
TC Watch / 熱帶氣旋 > Selected TC Review / 重要熱帶氣旋回顧 > 202018W (NANGKA 浪卡) [Refresh 更新]
 202018W (NANGKA 浪卡) - Profile 檔案 202018W (NANGKA 浪卡) - Profile 檔案 |
(First draft issued on October 17, 2020; final version issued on December 8, 2020)
(初稿於 2020 年 10 月 17 日發出,最後版本於 2020 年 12 月 8 日上載)
Brief profile of NANGKA | 浪卡小檔案:
| JTWC number 聯合颱風警報中心 (JTWC) 號碼 | 18W |
| International number 國際編號 | 2016 |
| Period of existence 生存時期 (JTWC) | 2020/10/12 02 HKT - 2020/10/15 08 HKT |
| Lifetime 壽命 (JTWC) | 3.25 days 日 |
| Maximum 1-minute wind (JTWC) JTWC 一分鐘平均最高中心風速 | 50 knots 節 (Severe Tropical Storm 強烈熱帶風暴) |
| Minimum pressure (JTWC) JTWC 最低氣壓 | 989 hPa 百帕 |
| Highest TC signal by HKO 香港天文台發出最高熱帶氣旋警告信號 |
8 (NE) (Gale or Storm Signal 烈風或暴風信號) |
| Closest point of approach by HKO 香港天文台所示之最接近距離 |
S 440 km (real-time warning and TC report 實時報告及熱帶氣旋報告) |
| Time of closest approach by HKO 香港天文台所示之最接近時間 |
2020/10/13 01 HKT (real-time warning 實時報告) / 02 HKT (TC report 熱帶氣旋報告) |
| Lowest pressure recorded at HKO 香港天文台錄得的最低氣壓 |
1006.7 hPa 百帕 (2020/10/12 15:53 HKT) |
TC signals in Hong Kong* 香港曾經生效的熱帶氣旋警告*:
| Signal 信號 |
Date and time 日期和時間 |
Distance from HK 與香港的距離 |
Predicted movement 預測移動趨勢 |
Max. 10-min winds 中心最高十分鐘平均風速 |
 |
2020/10/11 (SUN) 20:40 HKT | SE 790 km | W/WNW at 18 km/h | 45 km/h (25 knots, TD) |
 |
2020/10/12 (MON) 17:10 HKT | SSE 500 km | W/WNW at 22 km/h | 65 km/h (35 knots, TS) |
 |
2020/10/13 (TUE) 05:40 HKT | SSW 450 km | W/WNW at 22 km/h | 85 km/h (45 knots, TS) |
|
2020/10/13 (TUE) 19:40 HKT | SW 520 km | W/WNW at 20 km/h | 85 km/h (45 knots, TS) |
 |
2020/10/14 (WED) 02:40 HKT** | WSW 640 km | W/WNW at 20 km/h | 85 km/h (45 knots, TS) |
*Based on the information from real-time tropical cyclone warning bulletins.
*根據實時熱帶氣旋警報資料。
**The Strong Monsoon Signal was issued at the same time the #3 Strong Wind Signal was cancelled.
**強烈季候風信號於三號強風信號取消後隨即發出。
Percentile rank among storms with #8 Signal (at compilation of this review)*: *This measures the relative wind strength in Hong Kong caused by this storm compared with others that share the same signal. 指標顯示此風暴相對於其他發出同樣信號的風暴為香港帶來之風力強度 For more information, please refer to Wind Speed Data for TCs that Have Affected Hong Kong. 更多資訊載於 影響香港氣旋之風速數據 頁 |
Overall: 總計: |
|
Weak 弱 |
|||
| Component Ranks 分部等級 | ||||||
| Reference stations: 參考站: |
|
Weak 弱 |
||||
| Victoria Harbour: 維多利亞港: |
|
Moderately weak 中等偏弱 |
||||
| Urban: 市區: |
|
Weak 弱 |
||||
| Offshore & high ground 離岸和高地: |
|
Weak 弱 |
||||
Cyclones that attained similar rating (with signal #8): GONI (2009), PABUK (2nd approach, 2007) 相近級別之熱帶氣旋 (八號信號):天鵝 (2009)、帕布 (第二次靠近,2007) |
||||||
IR imagery animation 紅外線雲圖動畫:
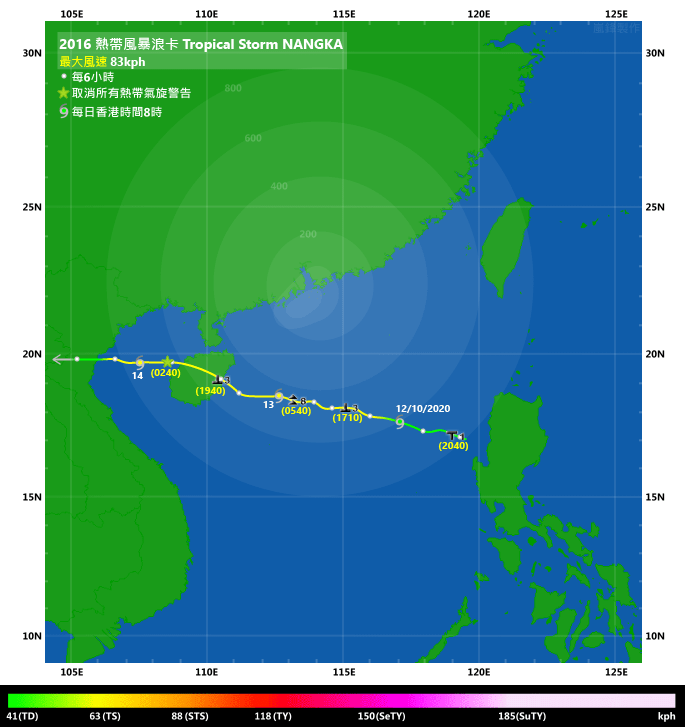
TC track from HKWW 本站的熱帶氣旋路徑圖:

TC track from HKO 天文台的熱帶氣旋路徑圖:

TC track with signal information 附有熱帶氣旋警告信號資料的路徑圖:
(Track figure courtesy of Lorenzo. Data from HKO. 鳴謝 Lorenzo 提供路徑圖,資料取自天文台)
| Past HKWW Bulletins 本站發佈 |
Please click here for bulletins on this tropical cyclone. 請按這裡。
| Storm Development Overview 風暴發展概覽 |
Unless otherwise stated, all times below are in Hong Kong Standard Time (UTC+8)
除非特別註明,下文時間均為香港標準時間 (協調世界時加 8 小時)
A tropical disturbance (93W) persisted near Luzon on October 10. The disturbance moved west into the South China Sea on October 11. With numerical models suggesting possible development in the Sea, the JTWC issued a tropical cyclone formation alert at 2 pm while the JMA issued a gale warning for the system at the same time. The disturbance was forecast to move west to west-northwest in the South China Sea towards Hainan Island, due to a prevalent subtropical ridge positioned in southern China and the northwest Pacific.
As 93W gathered more convections and showed signs of intensification during that night, the HKO upgraded it into a tropical depression at 7 pm. The JTWC made the upgrade at 2 am October 12, while the JMA upgraded it into a tropical storm at 2 pm October 12, naming it NANGKA. By that time, NANGKA had expanded its coverage in the South China Sea, and moisture was being fed into the storm continuously by an intense band of circulation in the southern side. The low vertical wind shear in the region also contributed to the storm's development.
NANGKA maintained a westerly to west-northwesterly course in the night of October 12 and daytime of October 13. The storm's core consolidated on October 13; the NMC (China) upgraded NANGKA into a severe tropical storm at 2 pm, and the storm made landfall in eastern Hainan at around 7 pm that night. It crossed Hainan and moved into the Gulf of Tonkin after midnight October 14, where it started to move west. The storm also shrank in size and gradually weakened even as it moved across a body of water.
NANGKA made its final landfall in northern Vietnam at around 6 pm October 14. It continued to move west and weakened into an area of low pressure in Laos early on October 15.
一個熱帶擾動 (93W) 於 10 月 10 日影響呂宋一帶。該擾動於 11 日西移並進入南海。由於數值模式顯示該系統或於南海發展,聯合颱風警報中心於下午 2 時對其發出熱帶氣旋形成警報,而日本氣象廳則於同時發出烈風警告。當時副熱帶高壓脊位於華南及西北太平洋,預料該擾動將向西至西北偏西移動,大致趨向海南島。
隨著 93W 對流漸長及於晚間有增強跡象,香港天文台於 11 日下午 7 時將其升格為熱帶低氣壓。聯合颱風警報中心於 12 日上午 2 時作出升格,而日本氣象廳則於 12 日下午 2 時將其升格為熱帶風暴,並命名為浪卡。這時,浪卡於南海的覆蓋範圍已擴闊,且其南面有一強對流帶,將水氣源源不絕地帶進系統中。該區垂直風切變亦較低,有利氣旋發展。
浪卡於 12 日晚及 13 日日間維持向西至西北偏西移動,而風暴中心於 13 日有所整固,中國中央氣象台於下午 2 時將浪卡升格為強烈熱帶風暴,而浪卡於下午約 7 時登陸海南東部。風暴當晚橫過海南島,於 14 日午夜過後進入北部灣並開始向西移動。浪卡於橫越北部灣時逐漸縮小並減弱。
浪卡於 14 日下午約 6 時於越南北部作最後一次登陸。登陸後風暴繼續西移,並於 15 日早段在老撾減弱為低壓區。
| Weather in Hong Kong During Approach 風暴影響時香港天氣狀況 |
Link to relevant HKO weather report bulletins:
11/10 ●
12/10 ●
13/10 ●
14/10
香港天文台相關天氣報告連結:11/10 ●
12/10 ●
13/10 ●
14/10
In Hong Kong, NANGKA became the first tropical cyclone in decades to necessitate the #8 Gale or Storm Signal despite never moving to within 400 km of the territory. The fact that NANGKA only reached tropical storm strength (as assessed by the HKO) made this an even rarer occurrence.
Before NANGKA crossed the South China Sea, several numerical models (most notably GFS) predicted the possibility of gales near Hong Kong even though NANGKA was never forecast to be close to the Guangdong coastline. Soon after the HKO upgraded NANGKA into a tropical depression, the #1 Standby Signal was issued at 8:40 pm October 11, when the cyclone was about 790 km southeast of Hong Kong. The HKO mentioned that winds were expected to strengthen later the next day due to a combination of the effects of NANGKA and the northeast monsoon, and the #3 Signal would be considered in the afternoon to evening of October 12.
In the morning of October 12, the HKO restricted the time point of issuing the #3 Signal to between 5 pm and 7 pm that afternoon. During the day, the weather in Hong Kong was generally fine with moderate east to northeasterly winds. The #3 Strong Wind Signal was issued at 5:10 pm, when NANGKA was about 500 km south-southeast of Hong Kong. The HKO pointed out that winds would continue to strengthen, and depending on the local wind conditions, the #8 Signal would be considered before dawn on October 13. Various cargo terminals suspended the handling of empty cargoes at 11 pm that night.
NANGKA's outer rainbands reached Hong Kong near midnight October 13. As a result, winds strengthened generally over the territory. Sustained gales were recorded at Waglan Island before midnight, while strong force winds were recorded at Cheung Chau Beach, Green Island, Hong Kong Sea School, Tate's Cairn and Peng Chau. NANGKA passed to the south of Hong Kong in the small hours; at about 440 km away, it was closest to the territory at around 2 am. The Pre-No. 8 Special Announcement was issued at 3:40 am, indicating that the #8 Signal would be issued by 6 am the latest. After a two-hour warning period, the HKO issued the #8 Northeast Gale or Storm Signal at 5:40 am. NANGKA had already gone past its closest point of approach to Hong Kong at that time; it was situated around 450 km south-southwest of the territory.
Around the time of the signal change, Waglan Island remained the only station to have recorded sustained gale force winds. Winds strengthened in the morning and Cheung Chau Beach registered gales after 6 am. Hong Kong Sea School and Tate's Cairn saw gales much later in the morning. Despite the somewhat stronger winds, the weather was relatively stable during the morning with little rainfall. There were even sunny intervals in some places. However, weather conditions deteriorated towards midday when another rainband approached the territory.
In the early afternoon, the HKO mentioned in its tropical cyclone warning bulletin that storm force winds were recorded at Huangmaozhou, an island about 45 km south of Hong Kong. The HKO however did not upgrade NANGKA into a severe tropical storm. Mainland meteorological observations indicated that several stations in offshore waters around that area recorded gale force winds. Despite the proximity of gales to Hong Kong, winds did not strengthen significantly in the afternoon. While winds reached gale force at Green Island, an elevated station within Victoria Harbour, sustained gales were not recorded in any of the eight reference wind stations. It could also be observed that winds in southern Hong Kong were significantly stronger than in the New Territories.
As NANGKA made landfall at Hainan Island, the HKO issued the #3 Strong Wind Signal at 7:40 pm, when NANGKA had already moved to about 520 km from Hong Kong. At this point, winds were still predominantly east to northeasterly, suggesting the significant role of the monsoon. It was perhaps unfortunate for the HKO that winds surged in some locations right after the #8 Signal was cancelled; near-gales were recorded at Cheung Chau (main station) and Peng Chau, and gales at Cheung Chau Beach and Green Island. Some of these stations recorded the strongest winds during NANGKA's approach.
NANGKA's rainbands moved away gradually during the night of October 13. However, winds in southern Hong Kong hovered between strong to gale force throughout the night. Early on October 14, the HKO determined that the northeast monsoon had begun to dominate, and replaced the #3 Signal by the Strong Monsoon Signal at 2:40 am. It was generally cloudy in Hong Kong on October 14, but rainfall was insignificant compared to the previous day.
As the #8 Signal was in force throughout daytime on October 13, many businesses were closed for the day. During NANGKA's approach, the government received 17 reports of fallen trees. Three people were injured and sought medical assistance at the emergency units of public hospitals. The HKO explained in a blog post that the #8 Signal was issued in light of model guidance on the possibility of gales near Hong Kong and at higher elevations, but admitted in a radio programme that the forecast error had led to weaker winds than predicted.
在香港,浪卡成為數十年來第一個於香港 400 公里外掠過但需發出八號烈風或暴風信號的熱帶氣旋。而更為罕見的是,按照天文台的估計,浪卡的巔峰強度只有熱帶風暴級。
浪卡橫過南海前,部分數值模式預報 (尤其是 GFS) 顯示雖然浪卡不會靠近廣東沿岸,但仍然有機會為香港附近帶來烈風。天文台於 10 月 11 日將浪卡升格為熱帶低氣壓後不久,就於下午 8 時 40 分發出一號戒備信號,當時氣旋位於香港東南約 790 公里。天文台表示,受浪卡及東北季候風的共同影響,風勢將於翌日增強,並將於 12 日下午至黃昏考慮改發三號信號。
12 日早上,天文台收窄發出三號信號時間的範圍至下午 5 至 7 時。當天日間香港大致天晴,吹和緩東至東北風。三號強風信號於下午 5 時 10 分發出,浪卡當時集結於香港東南偏南約 500 公里。由於預料風勢會繼續增強,天文台表示將視乎本地風勢,於 13 日日出前考慮改發八號信號。當天下午 11 時貨櫃碼頭暫停吉櫃交收。
浪卡的外圍雨帶於 13 日午夜左右到達香港,本地風勢普遍上揚。橫欄島午夜前錄得烈風,而長洲泳灘、青洲、香港航海學校、大老山及坪洲吹強風。浪卡於凌晨於香港以南掠過,它於上午約 2 時最接近香港,但距離亦有 440 公里。天文台於上午 3 時 40 分發出預警八號熱帶氣旋警告信號之特別報告,表示最遲將於上午 6 時改發八號信號。兩小時預警期過後,八號東北烈風或暴風信號於上午 5 時 40 分發出,當時浪卡位於香港西南偏南約 450 公里,已過最接近香港之處。
信號轉變之時,橫欄島仍是唯一吹烈風的氣象站。風勢於上午有所增強,長洲泳灘於 6 時過後錄得烈風,而香港航海學校及大老山則於上午較後時間吹烈風。雖然風勢稍為增強,但早上天氣頗為穩定,雨量甚少,部分地區更短暫時間有陽光。隨著另一道雨帶於接近中午靠近,本港天氣開始轉差。
下午早段,天文台於其熱帶氣旋警報中指出黃茅洲 (於香港南方約 45 公里處) 曾吹暴風,但並未將浪卡升格為強烈熱帶風暴。內地氣象數據顯示黃茅洲附近有數個離岸風速站錄得烈風。雖然烈風區離港不遠,但下午本地風勢並沒有明顯增強。位於維港但設於高處的青洲氣象站下午開始吹烈風,至於八個參考測風站則無一達標。香港南面的風勢明顯較新界強。
隨著浪卡登陸海南島,天文台於下午 7 時 40 分改發三號強風信號,浪卡當時已移至香港約 520 公里外。此時大部分地區仍吹東至東北風,顯示季候風正明顯影響本港。改發信號不久碰巧部分地方風勢加強,長洲主站及坪洲風勢近乎烈風水平,而長洲泳灘及青洲則吹烈風,部分站點更錄得風暴吹襲期間的最高風速。
浪卡的雨帶於 13 日晚間逐漸移離,但香港南部風勢整夜維持於強風至烈風水平。14 日早段,天文台認為東北季候風開始主導本港風勢,於上午 2 時 40 分發出強烈季候風信號以取代三號信號。當日香港大致多雲,但雨量較前一日大減。
由於八號信號於 13 日整段日間時間生效,市面大部分經濟活動當日暫停。浪卡襲港期間,政府共接獲 17 宗塌樹報告,三人受傷往公立醫院急症室求醫。天文台於其「天氣隨筆」網頁中解釋數值模式預料近香港地區及高地吹烈風,因此發出八號信號;其後於電台節目中承認預測工具出現誤差,導致風勢比預期弱。
| Image Gallery 圖片庫 |


Figure 1 - Numerical model forecast charts on October 10 (left: ECMWF; right: GFS) depicting possible gales near Hong Kong on October 13 (source: weather.us)
圖 1 - 10 月 10 日的數值模式預報圖 (左:ECMWF;右:GFS) 顯示 10 月 13 日香港附近或吹烈風 (來源: weather.us)

Figure 2 - Satellite image of NANGKA at 8 am October 12
圖 2 - 10 月 12 日上午 8 時浪卡之衛星雲圖

Figure 3 - Steering flow chart at 8 am October 12
圖 3 - 10 月 12 日上午 8 時之駛流場分佈圖


Figure 4 - Wind field analysis maps at 8:27 am October 12 (left) and 9:47 am October 13 (right)
圖 4 - 10 月 12 日上午 8 時 27 分 (左) 及 13 日上午 9 時 47 分 (右) 之風場掃描圖
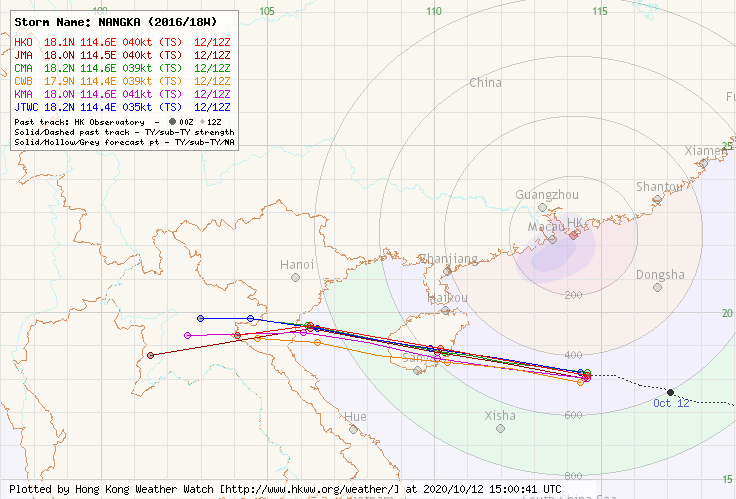
Figure 5 - Forecast tracks from various official agencies at 8 pm October 12
圖 5 - 10 月 12 日下午 8 時各官方氣象台之預測路徑
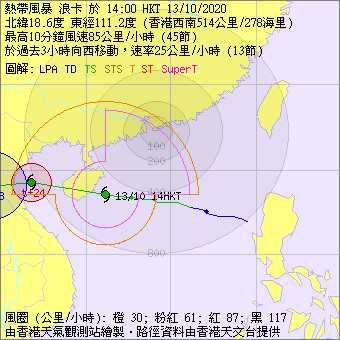
Figure 6 - HKO's forecast track and estimated wind radii at 2 pm October 13. The gale radius was estimated at 300 NM (556 km) in its northeastern quadrant.
圖 6 - 10 月 13 日下午 2 時香港天文台之預測路徑及估算風圈圖,當時估計其東北象限烈風圈半徑為 300 海里 (556 公里)

Figure 7 - Satellite image of NANGKA at peak intensity
圖 7 - 浪卡於巔峰強度時之衛星雲圖


Figure 8 - Radar images at 3-hour intervals from 10 am to 7 pm October 13
圖 8 - 10 月 13 日上午 10 時至下午 7 時每三小時之雷達圖


Figure 9 - Local wind distribution maps at 4-hour intervals from 4 am October 13 to midnight October 14
圖 9 - 10 月 13 日上午 4 時至 14 日午夜 12 時每四小時之本港風勢分布圖
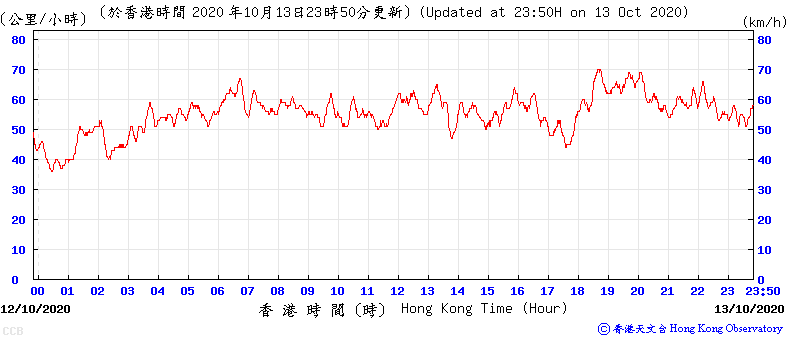
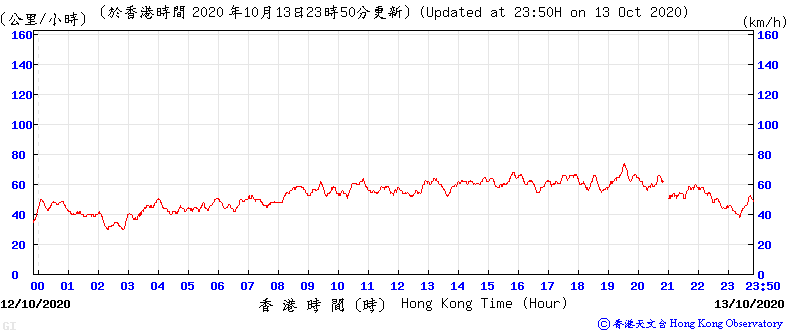
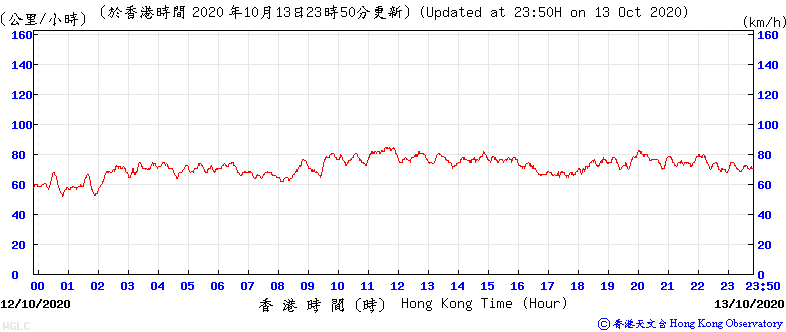
Figure 10 - Wind speed time series at Cheung Chau Beach, Green Island and Waglan Island (top to bottom) on October 13
圖 10 - 長洲泳灘、青洲及橫欄島 (上至下) 於 10 月 13 日之風速時間序列圖
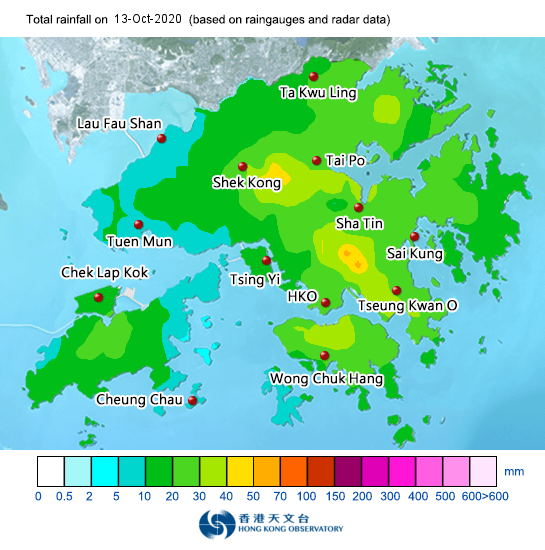
Figure 11 - Daily rainfall map for October 13
圖 11 - 10 月 13 日之總雨量圖
| Winds Recorded at Reference Stations 參考站所錄得的風速 |
The following table lists the maximum 10-minute average (sustained) wind speed recorded while tropical cyclone signals were in force. On some occasions, it is possible that the strongest winds were not recorded when the highest signal was in force.
下表列出各站於熱帶氣旋警告信號生效時所錄得的最高 10 分鐘平均 (持續) 風速,留意此風速不一定於最高信號生效期間錄得。
| Station 風速站 |
Max. 10-min avg. wind speed 最高十分鐘平均風速 |
Beaufort classification 蒲福氏風級分類 |
| Chek Lap Kok 赤鱲角 | 48 km/h | STRONG 強風 |
| Cheung Chau 長洲 | 60 km/h | STRONG 強風 |
| Kai Tak 啟德 | 37 km/h | Fresh 清勁 |
| Lau Fau Shan 流浮山 | 30 km/h | Moderate 和緩 |
| Sai Kung 西貢 | 53 km/h | STRONG 強風 |
| Sha Tin 沙田 | 28 km/h | Moderate 和緩 |
| Ta Kwu Ling 打鼓嶺 | 22 km/h | Moderate 和緩 |
| Tsing Yi (SHL) 青衣蜆殼油庫 | 26 km/h | Moderate 和緩 |
| Number of stations recording at least STRONG force (force 6 - 7) winds: | 3 |
| Number of stations recording at least GALE force (force 8 - 9) winds: | 0 |
| Number of stations recording at least STORM force (force 10 - 11) winds: | 0 |
| Number of stations recording HURRICANE force (force 12) winds: | 0 |
| 錄得 強風 (6 - 7 級) 或更高風速的站數: | 3 |
| 錄得 烈風 (8 - 9 級) 或更高風速的站數: | 0 |
| 錄得 暴風 (10 - 11 級) 或更高風速的站數: | 0 |
| 錄得 颶風 (12 級) 風速的站數: | 0 |
| Charts and Figures 各項數據 |
Table 1: Track data from HKWW:
表一 : 香港天氣觀測站之路徑資料
YYMMDDZZ Lat Long Wind |
Table 2: Maximum gust and hourly average wind speed recorded in Hong Kong from HKO:
表二 : 香港天文台公佈的各站最高每小時平均風力和陣風數據 (英文)
Maximum Gust |
Maximum Hourly Mean Wind |
|||||||
|---|---|---|---|---|---|---|---|---|
| Direction |
Speed (km/h) |
Date/Month |
Time |
Direction |
Speed (km/h) |
Date/Month |
Time |
|
| Bluff Head (Stanley) | E | 77 | 13/10 | 11:46 | E | 40 | 13/10 | 21:00 |
| Central Pier | E | 71 | 13/10 | 19:21 | E | 42 | 13/10 | 15:00 |
| E | 42 | 13/10 | 16:00 | |||||
| Cheung Chau | E | 81 | 13/10 | 13:27 | E | 56 | 14/10 | 00:00 |
| E | 81 | 14/10 | 01:42 | |||||
| Cheung Chau Beach | ENE | 90 | 13/10 | 13:31 | ENE | 66 | 13/10 | 20:00 |
| Green Island | ENE | 91 | 13/10 | 19:32 | ENE | 66 | 13/10 | 20:00 |
| Hong Kong International Airport | E | 62 | 13/10 | 12:26 | E | 42 | 13/10 | 13:00 |
| ENE | 62 | 13/10 | 13:47 | |||||
| Kai Tak | ENE | 70 | 13/10 | 19:24 | E | 29 | 14/10 | 02:00 |
| King's Park | E | 69 | 13/10 | 19:36 | E | 28 | 14/10 | 02:00 |
| Lamma Island | ESE | 82 | 13/10 | 19:45 | E | 35 | 14/10 | 00:00 |
| Lau Fau Shan | ENE | 48 | 14/10 | 00:27 | ENE | 26 | 13/10 | 17:00 |
| ENE | 26 | 13/10 | 18:00 | |||||
| ENE | 26 | 13/10 | 19:00 | |||||
| North Point | E | 77 | 13/10 | 18:35 | E | 44 | 14/10 | 02:00 |
| Peng Chau | E | 82 | 13/10 | 19:27 | E | 54 | 13/10 | 20:00 |
| Ping Chau | ENE | 40 | 13/10 | 20:59 | E | 16 | 13/10 | 23:00 |
| Sai Kung | ENE | 81 | 13/10 | 19:26 | ENE | 48 | 13/10 | 12:00 |
| Sha Chau | NE | 57 | 13/10 | 10:14 | E | 36 | 14/10 | 00:00 |
| Sha Lo Wan | E | 70 | 13/10 | 19:44 | E | 37 | 13/10 | 20:00 |
| E | 70 | 13/10 | 19:53 | |||||
| Sha Tin | NE | 69 | 13/10 | 11:28 | ENE | 22 | 13/10 | 13:00 |
| Star Ferry (Kowloon) | E | 65 | 14/10 | 02:00 | E | 35 | 14/10 | 00:00 |
| Ta Kwu Ling | E | 48 | 13/10 | 19:59 | E | 17 | 13/10 | 20:00 |
| Tai Mei Tuk | ENE | 71 | 13/10 | 11:43 | ENE | 49 | 13/10 | 13:00 |
| Tai Mo Shan | ESE | 113 | 13/10 | 19:41 | ESE | 73 | 14/10 | 00:00 |
| Tai Po Kau | E | 55 | 13/10 | 22:58 | E | 39 | 14/10 | 02:00 |
| E | 55 | 13/10 | 22:59 | |||||
| Tap Mun East | E | 68 | 14/10 | 00:07 | E | 48 | 14/10 | 01:00 |
| Tate's Cairn | E | 96 | 13/10 | 11:46 | E | 63 | 13/10 | 12:00 |
| Tseung Kwan O | SE | 49 | 14/10 | 01:23 | N | 16 | 13/10 | 07:00 |
| Tsing Yi Shell Oil Depot | SE | 50 | 13/10 | 12:58 | ESE | 22 | 13/10 | 14:00 |
| Tuen Mun Government Offices | NNE | 47 | 13/10 | 06:47 | N | 14 | 13/10 | 08:00 |
| Waglan Island | ENE | 97 | 13/10 | 11:33 | ENE | 82 | 13/10 | 12:00 |
| ENE | 97 | 13/10 | 19:58 | |||||
| Wetland Park | E | 35 | 14/10 | 00:23 | E | 14 | 14/10 | 01:00 |
| Wong Chuk Hang | ENE | 70 | 13/10 | 18:11 | ENE | 30 | 13/10 | 20:00 |
Table 3: Rainfall (in millimetres) contributed by NANGKA from HKO (figures in brackets are based on incomplete hourly data):
表三 : 香港天文台公佈的各站雨量資料 (英文) (方括號內之數據由不完整之每小時資料擷取)
| 11-Oct |
12-Oct |
13-Oct |
14-Oct |
Total Rainfall (mm) |
||
|---|---|---|---|---|---|---|
| Hong Kong Observatory (HKO) | 0.0 |
0.6 |
26.0 |
1.2 |
27.8 |
|
| Hong Kong International Airport (HKA) | 0.0 |
Trace |
13.5 |
Trace |
13.5 |
|
| Cheung Chau (CCH) | 0.0 |
0.0 |
7.0 |
0.0 |
7.0 |
|
| H23 | Aberdeen | 0.0 |
0.5 |
17.5 |
1.0 |
19.0 |
| N05 | Fanling | 0.0 |
0.0 |
14.5 |
0.0 |
14.5 |
| N13 | High Island | 0.0 |
0.0 |
18.5 |
0.0 |
18.5 |
| K04 | Jordan Valley | 0.0 |
0.5 |
36.5 |
2.5 |
39.5 |
| N06 | Kwai Chung | 0.0 |
0.5 |
24.5 |
2.0 |
27.0 |
| H12 | Mid Levels | 0.0 |
0.0 |
28.0 |
3.0 |
31.0 |
| N09 | Sha Tin | 0.0 |
0.0 |
35.5 |
0.5 |
36.0 |
| H19 | Shau Kei Wan | 0.0 |
0.5 |
29.0 |
0.5 |
30.0 |
| SEK | Shek Kong | 0.0 |
0.0 |
31.0 |
1.0 |
32.0 |
| K06 | So Uk Estate | 0.0 |
0.5 |
24.5 |
1.5 |
26.5 |
| R31 | Tai Mei Tuk | 0.0 |
0.0 |
25.5 |
0.5 |
26.0 |
| R21 | Tap Shek Kok | 0.0 |
0.0 |
10.0 |
0.0 |
10.0 |
| N17 | Tung Chung | 0.0 |
0.0 |
27.0 |
0.5 |
27.5 |
| TMR | Tuen Mun Reservoir | 0.0 |
0.0 |
11.3 |
0.0 |
11.3 |
Last Accessed 最近訪問日期: Sun Sep 08 2024 12:40:42 HKT
Last Modified 最近修訂日期: Mon Jul 24 2023
