
TC Watch / 熱帶氣旋 > Selected TC Review / 重要熱帶氣旋回顧 > 201913W (PODUL 楊柳) [Refresh 更新]
 201913W (PODUL 楊柳) - Profile 檔案 201913W (PODUL 楊柳) - Profile 檔案 |
(First draft issued on September 7, 2019; final version issued on November 14, 2019)
(初稿於 2019 年 9 月 7 日發出,最後版本於 2019 年 11 月 14 日上載)
Brief profile of PODUL | 楊柳小檔案:
| JTWC number 聯合颱風警報中心 (JTWC) 號碼 | 13W |
| International number 國際編號 | 1912 |
| Period of existence 生存時期 (JTWC) | 2019/08/26 20 HKT - 2019/08/30 08 HKT |
| Lifetime 壽命 (JTWC) | 3.50 days 日 |
| Maximum 1-minute wind (JTWC) JTWC 一分鐘平均最高中心風速 | 35 knots 節 (Tropical Storm 熱帶風暴) |
| Minimum pressure (JTWC) JTWC 最低氣壓 | 995 hPa 百帕 |
| Highest TC signal by HKO 香港天文台發出最高熱帶氣旋警告信號 |
1 (Standby Signal 戒備信號) |
| Closest point of approach by HKO 香港天文台所示之最接近距離 |
S 560 km (real-time warning and TC report 實時報告及熱帶氣旋報告) |
| Time of closest approach by HKO 香港天文台所示之最接近時間 |
2019/08/29 02 HKT (real-time warning and TC report 實時報告及熱帶氣旋報告) |
| Lowest pressure recorded at HKO 香港天文台錄得的最低氣壓 |
1003.7 hPa 百帕 (2019/08/28 17:28 HKT) |
TC signals in Hong Kong* 香港曾經生效的熱帶氣旋警告*:
| Signal 信號 |
Date and time 日期和時間 |
Distance from HK 與香港的距離 |
Predicted movement 預測移動趨勢 |
Max. 10-min winds 中心最高十分鐘平均風速 |
 |
2019/08/28 (WED) 14:40 HKT | SSE 640 km | W/WNW at 25 km/h | 75 km/h (40 knots, TS) |
 |
2019/08/29 (THU) 12:20 HKT | SW 660 km | W at 25 km/h | 85 km/h (45 knots, TS) |
*Based on the information from real-time tropical cyclone warning bulletins.
*根據實時熱帶氣旋警報資料。
IR imagery animation 紅外線雲圖動畫:
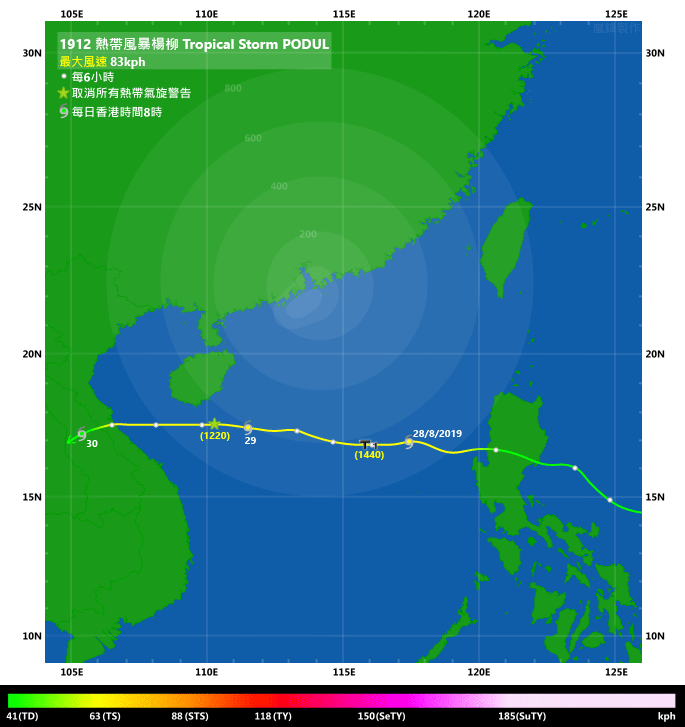
TC track from HKWW 本站的熱帶氣旋路徑圖:
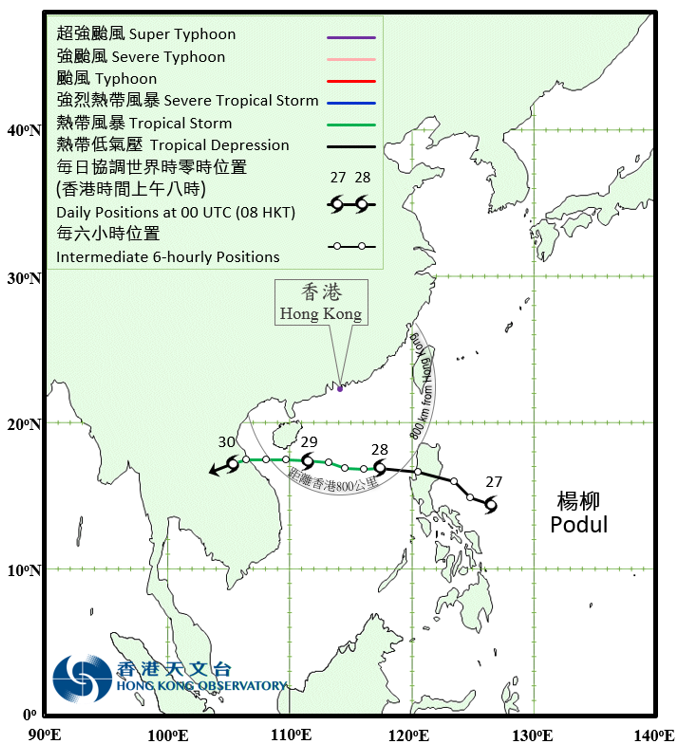
TC track from HKO 天文台的熱帶氣旋路徑圖:
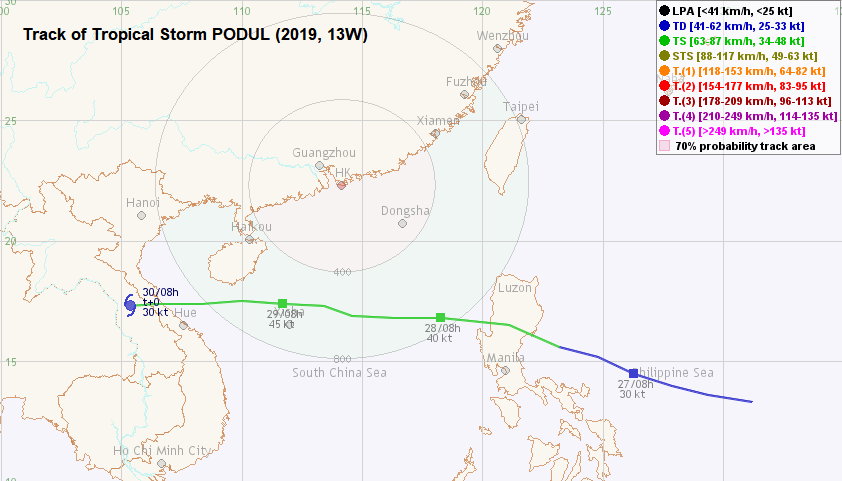
TC track with signal information 附有熱帶氣旋警告信號資料的路徑圖:
(Track figure courtesy of Lorenzo. Data from HKO. 鳴謝 Lorenzo 提供路徑圖,資料取自天文台)
| Past HKWW Bulletins 本站發佈 |
Please click here for bulletins on this tropical cyclone. 請按這裡。
| Storm Development Overview 風暴發展概覽 |
Unless otherwise stated, all times below are in Hong Kong Standard Time (UTC+8)
除非特別註明,下文時間均為香港標準時間 (協調世界時加 8 小時)
A patch of convections (tropical depression 99W) east of the Philippines showed signs of development on August 25. The JTWC issued a tropical cyclone formation alert on this disturbance that afternoon. 99W moved west-northwest quickly that day, and the alert was renewed on August 26. The JMA issued a gale warning on the system at 8 am that day.
99W was seen strengthening during the night of August 26. The JTWC upgraded it into tropical depression 13W that night. 13W was moving along the southern periphery of the subtropical ridge, and more substantial development was expected to take place when the depression entered the South China Sea. As a result of the substantial vertical wind shear in the area, 13W's convections were concentrated in its western side. Nevertheless, as 13W developed, the JMA upgraded it into a tropical storm at 8 am August 27 and named it PODUL. The HKO then upgraded PODUL into a tropical depression at 10 am.
PODUL continued to move west-northwest during the day, and made landfall at Luzon near midnight August 28. PODUL's convections were so sheared that, upon its landfall in the Philippines, most of its convections had already entered the South China Sea. Due to its quick motion, PODUL's centre emerged into the South China Sea near dawn. The HKO upgraded PODUL into a tropical storm at this point.
Some development was seen during the day of August 28 as PODUL moved west in central South China Sea. Its core structure improved but the storm did not manage to maintain convections in all quadrants. After spending more than a day in the Sea, PODUL made landfall in central Vietnam near 2 am August 30, still as a tropical storm. It gradually weakened on land and into an area of low pressure that afternoon.
位於菲律賓以東的對流雲團 (熱帶擾動 99W) 於 8 月 25 日有發展跡象,聯合颱風警報中心於下午對其發佈熱帶氣旋形成警報。99W 當天向西北偏西快速移動,而該警報於 26 日被更新。日本氣象廳於 26 日上午 8 時對其發出烈風警報。
99W 於 26 日晚有所增強,聯合颱風警報中心將其升格為熱帶低氣壓 13W。13W 正沿副熱帶高壓脊南部移動,預料系統進入南海後將有更明顯發展。由於該區垂直風切變較高,13W 的對流集中在其西面。雖然如此,隨著 13W 發展,日本氣象廳於 27 日上午 8 時將其升格為熱帶風暴,並命名為楊柳,而香港天文台於上午 10 時將楊柳升格為熱帶低氣壓。
楊柳當天日間向西北偏西移動,並於 28 日近午夜登陸呂宋。楊柳的對流大幅向西切離,它登陸菲律賓之時絕大部分對流已經進入南海。由於楊柳移速較高,楊柳的中心亦於破曉時份進入南海,而香港天文台亦將其升格為熱帶風暴。
楊柳於 28 日在南海西移時有所發展,其中心結構改善,但對流未能於所有象限維持。楊柳用了一日多的時間橫過南海,於 30 日上午約 2 時以熱帶風暴強度登陸越南中部。它於內陸逐漸減弱,至下午減弱為低壓區。
| Weather in Hong Kong During Approach 風暴影響時香港天氣狀況 |
Link to relevant HKO weather report bulletins:
28/8 ●
29/8
香港天文台相關天氣報告連結:28/8 ●
29/8
The HKO reminded citizens of the presence of PODUL early on August 28, stating that there was no direct threat to Hong Kong at the time being due to its great distance from the territory. As PODUL crossed the South China Sea, the #1 Standby Signal was issued at 2:40 pm that afternoon, when it was situated around 640 km south-southeast of Hong Kong.
Later that day, winds strengthened in offshore areas and on high ground, reaching strong force at Green Island, Peng Chau, Tap Mun, Tate's Cairn and Waglan Island. Central Pier, Cheung Chau and North Point also registered strong winds in the small hours of August 29. However, such winds were short-lived as PODUL quickly moved to the west after making its closest point of approach at around 2 am, at a distance of 560 km. Winds diminished in the morning and further after midday; the #1 Standby Signal was therefore cancelled at 12:20 pm, when PODUL was around 660 km southwest of Hong Kong.
There was little precipitation during PODUL's passage. The weather was mainly fine on August 28, and there were sunny intervals on August 29 and 30.
香港天文台於 8 月 28 日提醒市民楊柳的動向,表示由於風暴距離香港尚遠,它暫時對香港無直接威脅。隨著楊柳橫過南海,一號戒備信號於當天下午 2 時 40 分發出,當時楊柳集結於香港東南偏南約 640 公里。
本港離岸及高地風勢於 28 日較後時間有所增強,其中青洲、坪洲、塔門、大老山及橫瀾島吹強風。中環碼頭、長洲及北角亦於 29 日凌晨錄得強風。楊柳於 29 日上午約 2 時最接近香港,距離為大約 560 公里。由於楊柳以高速西移,強風維持時間不算太長,當天早上風勢逐漸緩和,中午後進一步減弱。一號戒備信號於下午 12 時 20 分取消,當時楊柳位於香港西南約 660 公里。
楊柳靠近時降雨不多,本港於 28 日大致天晴,而 29 及 30 日亦間中有陽光。
| Image Gallery 圖片庫 |

Figure 1 - Satellite image of PODUL during its initial stages of formation
圖 1 - 楊柳形成初期之衛星雲圖
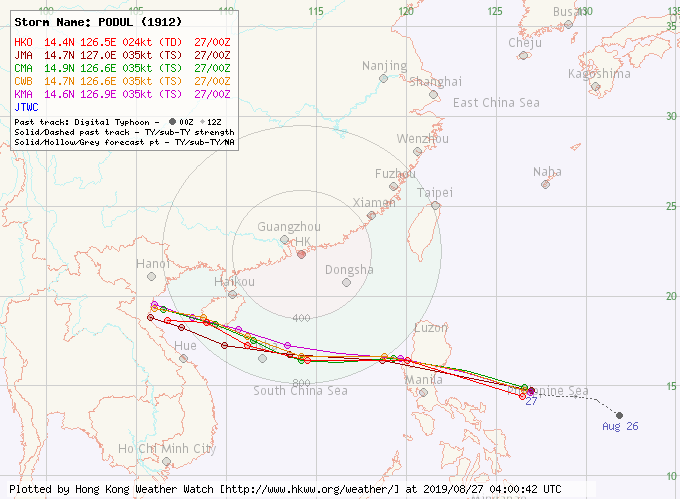
Figure 2 - Forecast tracks from various official agencies on August 27
圖 2 - 8 月 27 日各官方氣象台之預測路徑

Figure 3 - Steering flow chart at 8 am August 28
圖 3 - 8 月 28 日上午 8 時之駛流場圖

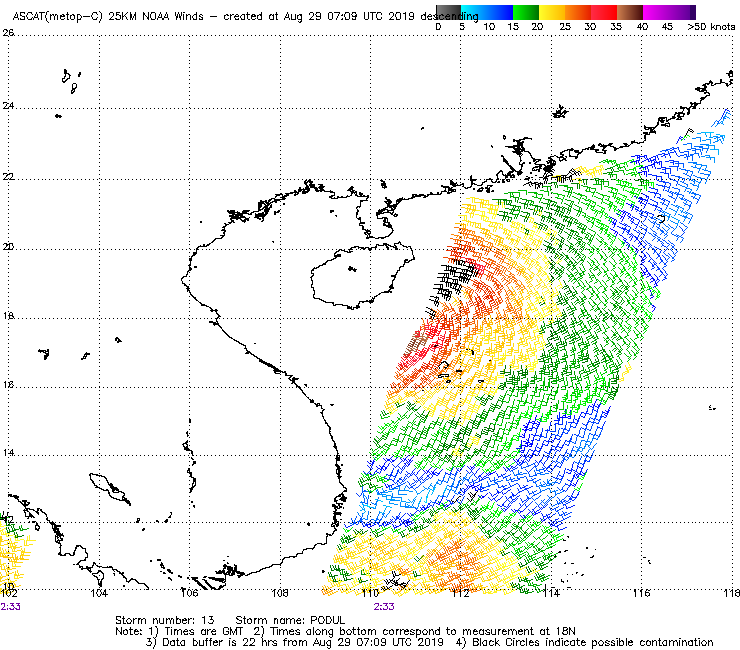
Figure 4 - Wind field analysis at 10:01 pm August 28 (left) and 10:33 am August 29 (right)
圖 4 - 8 月 28 日下午 10 時 01 分 (左) 及 29 日上午 10 時 33 分 (右) 之風場掃描圖

Figure 5 - Satellite image of PODUL near its closest point of approach to Hong Kong
圖 5 - 楊柳最接近香港時之衛星雲圖
| Winds Recorded at Reference Stations 參考站所錄得的風速 |
Except for special cases, this section is not available for cyclones that only necessitated the Standby Signal. 除非特別情況,否則此部只當氣旋令天文台發出三號或更高信號時提供。
| Charts and Figures 各項數據 |
Table 1: Track data from HKWW:
表一 : 香港天氣觀測站之路徑資料
YYMMDDZZ Lat Long Wind |
Table 2: Maximum gust and hourly average wind speed recorded in Hong Kong from HKO:
表二 : 香港天文台公佈的各站最高每小時平均風力和陣風數據 (英文)
| Station | Maximum Gust | Maximum Hourly Mean Wind | ||||||
|---|---|---|---|---|---|---|---|---|
| Direction | Speed (km/h) |
Date/Month | Time | Direction | Speed (km/h) |
Date/Month | Time | |
| Bluff Head (Stanley) | ENE | 65 | 29/8 | 04:42 | E | 30 | 29/8 | 02:00 |
| ENE | 30 | 29/8 | 05:00 | |||||
| Central Pier | E | 56 | 29/8 | 04:40 | E | 34 | 29/8 | 05:00 |
| Cheung Chau | ESE | 63 | 29/8 | 04:22 | E | 40 | 29/8 | 05:00 |
| Cheung Chau Beach | - | 68 | 29/8 | 03:06 | - | 47 | 29/8 | 04:00 |
| Green Island | ENE | 67 | 29/8 | 04:26 | ENE | 45 | 29/8 | 05:00 |
| Hong Kong International Airport | E | 47 | 29/8 | 00:38 | E | 34 | 29/8 | 01:00 |
| Kai Tak | E | 59 | 29/8 | 04:43 | E | 25 | 29/8 | 05:00 |
| Lamma Island | E | 58 | 29/8 | 03:50 | E | 25 | 29/8 | 04:00 |
| King's Park | E | 56 | 29/8 | 01:52 | E | 22 | 29/8 | 03:00 |
| Lau Fau Shan | ENE | 52 | 29/8 | 09:59 | ENE | 30 | 29/8 | 12:00 |
| North Point | E | 59 | 29/8 | 03:05 | E | 36 | 29/8 | 05:00 |
| Peng Chau | E | 52 | 29/8 | 04:36 | E | 40 | 29/8 | 05:00 |
| Ping Chau | E | 31 | 28/8 | 23:54 | E | 14 | 29/8 | 02:00 |
| Sai Kung | ENE | 49 | 29/8 | 03:47 | ENE | 31 | 29/8 | 09:00 |
| Sha Chau | ESE | 43 | 29/8 | 04:41 | SE | 31 | 28/8 | 22:00 |
| ESE | 43 | 29/8 | 04:50 | |||||
| Sha Lo Wan | ESE | 54 | 28/8 | 23:27 | E | 27 | 29/8 | 03:00 |
| ESE | 54 | 28/8 | 23:31 | |||||
| Sha Tin | NE | 47 | 29/8 | 04:28 | E | 16 | 29/8 | 05:00 |
| Shek Kong | E | 58 | 29/8 | 04:41 | E | 23 | 29/8 | 09:00 |
| Star Ferry (Kowloon) | E | 49 | 29/8 | 04:31 | E | 25 | 29/8 | 03:00 |
| Ta Kwu Ling | E | 38 | 28/8 | 22:05 | E | 16 | 28/8 | 23:00 |
| Tai Mo Shan | E | 83 | 29/8 | 02:07 | E | 54 | 29/8 | 02:00 |
| Tai Po Kau | E | 45 | 29/8 | 04:21 | E | 34 | 29/8 | 05:00 |
| Tap Mun East | E | 62 | 29/8 | 01:34 | E | 45 | 29/8 | 01:00 |
| E | 45 | 29/8 | 02:00 | |||||
| Tate's Cairn | - | 72 | 29/8 | 04:30 | - | 45 | 29/8 | 05:00 |
| Tseung Kwan O | E | 45 | 29/8 | 04:43 | ENE | 12 | 29/8 | 11:00 |
| Tsing Yi Shell Oil Depot | ESE | 45 | 29/8 | 03:57 | ESE | 19 | 29/8 | 04:00 |
| Tuen Mun Government Offices | ESE | 52 | 29/8 | 12:11 | ESE | 14 | 28/8 | 22:00 |
| Waglan Island | ENE | 67 | 29/8 | 04:26 | ENE | 51 | 29/8 | 08:00 |
| Wetland Park | ESE | 38 | 29/8 | 10:19 | E | 16 | 29/8 | 11:00 |
| ENE | 38 | 29/8 | 12:09 | |||||
| Wong Chuk Hang | ENE | 58 | 29/8 | 02:27 | ENE | 22 | 29/8 | 04:00 |
| ENE | 22 | 29/8 | 05:00 | |||||
Table 3: Rainfall (in millimetres) contributed by PODUL from HKO (figures in brackets are based on incomplete hourly data):
表三 : 香港天文台公佈的各站雨量資料 (英文) (方括號內之數據由不完整之每小時資料擷取)
| Station | 28-Aug | 29-Aug | Total Rainfall (mm) |
|
|---|---|---|---|---|
| Hong Kong Observatory (HKO) | 0.0 | 5.9 | 5.9 | |
| Hong Kong International Airport (HKA) | 0.0 | 13.2 | 13.2 | |
| Cheung Chau (CCH) | 0.0 | 8.5 | 8.5 | |
| H23 | Aberdeen | 0.0 | 23.5 | 23.5 |
| N05 | Fanling | 0.0 | 5.5 | 5.5 |
| N13 | High Island | 0.0 | 7.5 | 7.5 |
| K04 | Jordan Valley | 0.0 | 14.0 | 14.0 |
| N06 | Kwai Chung | 0.0 | 11.5 | 11.5 |
| H12 | Mid Levels | 0.0 | 12.5 | 12.5 |
| N09 | Sha Tin | 0.0 | 10.0 | 10.0 |
| H19 | Shau Kei Wan | 0.0 | 7.0 | 7.0 |
| SEK | Shek Kong | 0.0 | 3.0 | 3.0 |
| K06 | So Uk Estate | 0.0 | 16.5 | 16.5 |
| R31 | Tai Mei Tuk | 0.0 | 4.5 | 4.5 |
| R21 | Tap Shek Kok | 0.0 | 6.0 | 6.0 |
| N17 | Tung Chung | 0.0 | 11.5 | 11.5 |
| TMR | Tuen Mun Reservoir | 0.0 | 10.5 | 10.5 |
Last Accessed 最近訪問日期: Sun Sep 08 2024 12:48:03 HKT
Last Modified 最近修訂日期: Mon Jul 24 2023
