
TC Watch / 熱帶氣旋 > Selected TC Review / 重要熱帶氣旋回顧 > 201122W (NALGAE 尼格) [Refresh 更新]
 201122W (NALGAE 尼格) - Profile 檔案 201122W (NALGAE 尼格) - Profile 檔案 |
(Issued on October 21, 2011)
(於 2011 年 10 月 21 日發出)
Additional Information 附加資料 : Wind Speed Data for TCs that Have Affected Hong Kong 影響香港氣旋之風速數據
Brief profile of NALGAE 尼格小檔案:
| JTWC number 聯合颱風警報中心 (JTWC) 號碼 | 22W |
| International number 國際編號 | 1119 |
| Period of existence 生存時期 (JTWC) | 2011/09/27 14 HKT - 2011/10/05 20 HKT |
| Lifetime 壽命 (JTWC) | 8.25 days 日 |
| Maximum 1-minute wind (JTWC) JTWC 一分鐘平均最高中心風速 | 130 knots 節 (Category 4 Super Typhoon 四級超級颱風) |
| Minimum pressure (JTWC) JTWC 最低氣壓 | 926 hPa 百帕 |
| Highest TC signal by HKO (if applicable) 香港天文台發出最高熱帶氣旋警告信號 |
3 (Strong Wind Signal 強風信號) |
| Closest point of approach by HKO (if applicable) 香港天文台所示之最接近距離 (如適用) |
S 510 km (real-time warning 實時報告 and 及 TC Report 熱帶氣旋報告) |
| Time of closest approach by HKO (if applicable) 香港天文台所示之最接近時間 (如適用) |
2011/10/03 11 HKT (real-time warning 實時報告) / 10-17 HKT (TC Report 熱帶氣旋報告) |
| Lowest pressure recorded at HKO (if applicable) 香港天文台錄得的最低氣壓 (如適用) |
1007.6 hPa 百帕 (2011/10/02 16:41 HKT) |
TC signals for Hong Kong & Track 香港曾經生效的熱帶氣旋警告和路徑圖:
Table 表:
| Signal 信號 |
Date and time 日期和時間 |
Distance from HK 與香港的距離 |
Predicted movement 預測移動方向和速度 |
Max. 10-min winds 中心最高十分鐘平均風速 |
 |
2011/10/02 (SUN) 10:40 HKT |
SSE 740 km |
W at 16 km/h |
130 km/h (70 knots, CAT. 1 / TY) |
 |
2011/10/03 (MON) 06:40 HKT |
S 510 km |
W / WNW at 14 km/h |
110 km/h (60 knots, STS) |
 |
2011/10/03 (MON) 19:10 HKT* |
S 520 km |
W / WNW at 14 km/h |
90 km/h (50 knots, STS) |
*The Strong Wind Signal was replaced by the Strong Monsoon Signal at 19:10 HKT on October 3.
*三號強風信號在 10 月 3 日下午 7 時 10 分被強烈季候風信號取代。
Figure 圖:
(Track courtesy of Lorenzo. Data from HKO. 鳴謝 Lorenzo 提供路徑圖,資料取自天文台)
Percentile Ranks 百分等級:
Percentile rank among storms with #3 Signal (at compilation of this review)*: *This measures the relative wind strength in Hong Kong caused by this storm compared with others that share the same signal. 指標顯示此風暴相對於其他發出同樣信號的風暴為香港帶來之風力強度 For more information, please refer to Wind Speed Data for TCs that Have Affected Hong Kong. 更多資訊載於 影響香港氣旋之風速數據 頁 |
Overall: 總計: |
|
Weak 弱 |
|||
| Component Ranks 分部等級 | ||||||
| Reference stations: 參考站: |
|
Weak 弱 |
||||
| Victoria Harbour: 維多利亞港: |
|
Weak 弱 |
||||
| Urban: 市區: |
|
Weak 弱 |
||||
| Offshore & high ground 離岸和高地: |
|
Weak 弱 |
||||
IR imagery animation 紅外線雲圖動畫:
TC track from HKWW 本站的熱帶氣旋路徑圖:

TC track from HKO 天文台的熱帶氣旋路徑圖:

| Past HKWW Bulletins on NALGAE 本站有關尼格的發佈 |
Please click here for bulletins on NALGAE. 請按這裡。
| Storm Formation and Development 氣旋形成和發展 |
Unless otherwise stated, all times below are in Hong Kong Standard Time (UTC+8)
除非特別註明,下文時間均為香港標準時間 (協調世界時加 8 小時)
NALGAE developed as a tropical disturbance at a relatively high latitude, just about 750 km SSW of Iwo Jima. Initial numerical models indicated that a rather strong ridge would persist to the north of the disturbance so that it would keep moving west. The JTWC upgraded it into tropical depression 22W on September 27. 22W was moving slowly at that time but the track speed was expected to increase due to the strengthening of the subtropical ridge.
22W intensified steadily and was upgraded into a tropical storm by the JMA at 02 HKT on September 28. The name used was NALGAE from North Korea, meaning wing. All agencies predicted a westward track with the storm skirting northern Luzon or passing through Luzon Strait.
Shear was light in NALGAE's vicinity, and sea temperatures were decent. Under such favourable conditions NALGAE strengthened into a typhoon on September 29. However, the ridge was well-established and NALGAE lost some latitude on that day. Agencies shifted their forecast tracks southward, meaning that northern Luzon would encounter another tropical cyclone landfall just a few days after the onslaught of NESAT.
尼格在硫磺島西南偏南約 750 公里之較高緯度上形成。數值預報模式大致預測副熱帶高壓脊將維持強勢,令該擾動平穩地向西移動。JTWC 於 9 月 27 日將其升格為熱帶低氣壓 22W,它初時移動緩慢,但由於副高增強,當時預測移速會逐漸增加。
22W 穩步增強,日本氣象廳於 28 日上午 2 時將其升格為熱帶風暴,並給予名稱尼格。尼格一名由北韓提供,意思為翅膀。所有官方氣象台預料尼格西移並將擦過呂宋北端或通過呂宋海峽。
尼格一帶風切微弱,海溫良好,在此有利環境下尼格得以在 29 日增強至颱風強度。副高的勢力令尼格於當日稍為南移,氣象台亦把它們的預測路徑南調,意味著呂宋將繼納沙後一星期內兩受熱帶氣旋登陸影響。
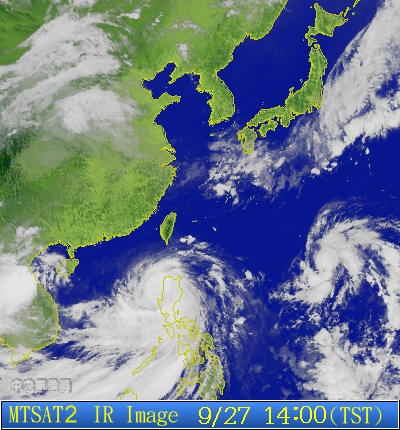
Figure 1 - NALGAE at early stage of formation. The storm at the Philippines is NESAT.
圖 1 - 尼格形成初期。位於菲律賓的風暴為納沙

Figure 2 - Initial forecast track by the JTWC
圖 2 - JTWC 之首佈預測

Figure 3 - Steering map at 14 HKT on September 29
圖 3 - 9 月 29 日下午 2 時之駛流圖
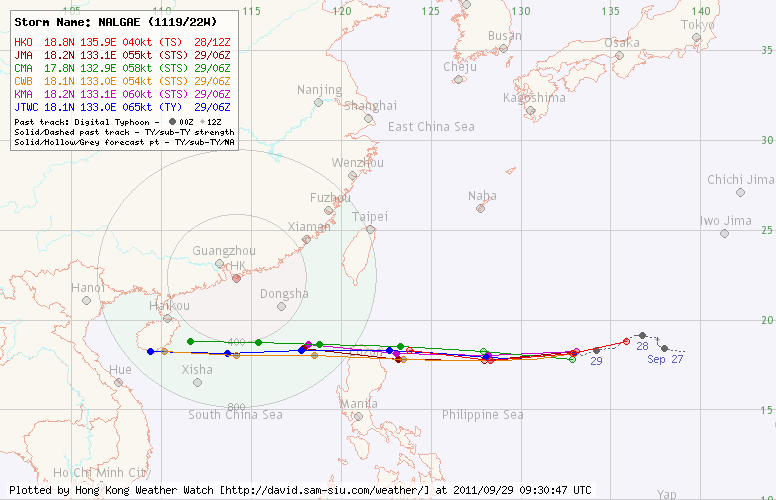
Figure 4 - Forecast tracks by various official agencies on September 29
圖 4 - 官方氣象台 9 月 29 日之預測路徑
| Reaching Luzon and Crossing South China Sea 抵達呂宋和橫過南海 |
NALGAE accelerated and continued to dip southward on September 30. It had also developed an eye, discernible on visible light imagery. However, the eye was rather small and was not always clear on satellite images at first. The eye became clearer and visible on infrared imagery near the midnight of October 1. The JTWC upgraded NALGAE into a super typhoon at 08 HKT, with an estimated wind speed of 130 knots. Other agencies were generally putting strengths of around 95 knots. Despite the different wind speed standards used such disparity was still quite significant.
Just a couple of hours after reaching peak intensity NALGAE made landfall near Dinapigue, Isabela. This was just several tens of kilometres north of the landfall position of typhoon NESAT, and at a much higher intensity. Because NESAT had already dropped large amount of rain, the primary threat to northern Philippines was flooding. Again due to the strong subtropical ridge NALGAE tracked fairly quickly across Luzon, and entered South China Sea near sunset. However, floods at northern Philippines persisted for a few more days. Dozens of people were killed by the two cyclones that battered the region that week.
The #1 Standby Signal was issued at 10:40 HKT on October 2 as NALGAE entered the 800-km circle. The Observatory predicted that NALGAE would move W to WNW and winds in the territory would strengthen later on as NALGAE moved to the south of Hong Kong. NALGAE's presence was felt locally when the first outer rainband associated with the storm affected the territory at around noon.
NALGAE's structure deteriorated after leaving the Philippines, the situation being the worst in its eastern semicircle. Initially agencies were still optimistic about NALGAE's strength as it crossed South China Sea, but such intensity projections were lowered substantially as NALGAE failed to regain strength long after it entered sea. NALGAE was downgraded into a severe tropical storm in the afternoon of October 2. At that time sea temperatures at western South China Sea were rather low due to the recent passage of NESAT, and NALGAE was struggling to maintain intensity.
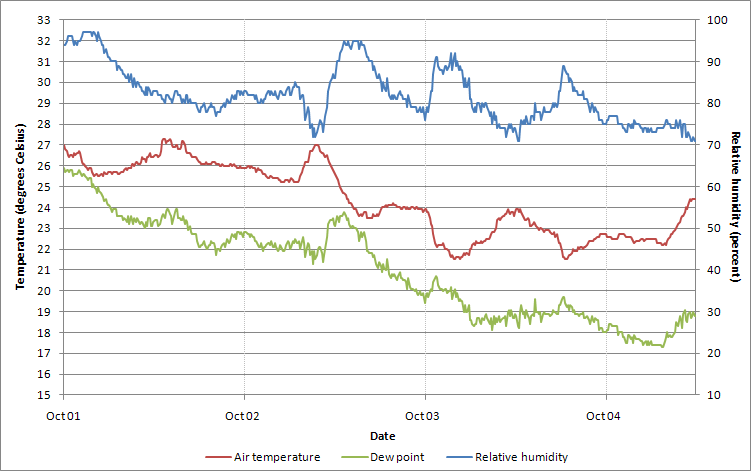
A surge of northeast monsoon was affecting southern China. NALGAE's presence steepened the pressure gradient and local winds were generally on a rising trend in the afternoon of October 2. Winds continued to strengthen on October 3 with occasional showers, but the wind direction remained north to northeasterly. The Observatory issued the #3 Strong Wind Signal at 06:40 HKT. Stations such as Cheung Chau, Green Island and Waglan Island registered strong force winds, while gale force winds were observed at high-altitude stations such as Ngong Ping and Tate's Cairn. NALGAE took a WNW track that morning, allowing it to edge a bit closer. Wind direction, however, remained north to northeasterly. Together with the observation that air temperature and dew point dropped significantly during the night of October 2, it seems that a replenishment of the northeast monsoon was contributing more to the increase in wind speed.
As NALGAE moved west, it arrived at its closest point of approach at around 11 HKT on October 3, when it was around 510 km south of Hong Kong. The Observatory noticed that NALGAE was showing signs of weakening and that its influence to Hong Kong was diminishing. At 19:10 HKT, the Strong Wind Signal was replaced by the Strong Monsoon Signal to signify that monsoon became the dominant force responsible for the strong winds observed in the territory. That was the first time in many years that the Strong Monsoon Signal directly replaced tropical cyclone warning signals. Since flooding occurred at low-lying areas the day before, the Observatory also warned against flooding again that night during high tide.
尼格在 9 月 30 日加速西移,並繼續稍為南移。它亦發展出一風眼,在可見光雲圖上能辨認到。可是風眼尺寸較細,初時並不清晰,至 10 月 1 日午夜左右才能於紅外線衛星雲圖上清楚看到。JTWC 在當天早上 8 時將尼格升格為超級颱風,估計風速達 130 節。其他氣象台大多估計尼格風速為 95 節,雖然它們與 JTWC 的風速標準不同,但此分歧仍較大。
到達顛峰強度後不久,尼格於伊莎貝拉省 Dinapigue 市登陸,地點為數天前納沙登陸處以北數十公里,而且尼格登陸時比納沙強。由於納沙已為當地帶來大量雨水,水浸成為呂宋最大威脅。處於強勢的副高令尼格得以快速通過菲律賓,在 1 日日落前後進入南海,但菲律賓廣泛地區水浸情況則持續數天。在當地,納沙和尼格造成數十人死亡。
隨著尼格於 2 日早上進入本港 800 公里範圍,香港天文台於上午 10 時 40 分發出一號戒備信號。天文台預料尼格將向西或西北偏西移動,當它到達本港以南時香港風勢將增強。尼格的首條外圍雨帶在中午時份影響本港。
尼格的結構由於登陸菲律賓而受到破壞,其東半圓情況尤為嚴重。初時氣象台對於尼格後期的強度仍較為樂觀,但因為尼格未有任何增強跡象,強度預測開始往下調。尼格於 2 日下午減弱為強烈熱帶風暴,而由於南海西部海溫受早前納沙通過影響而降低,尼格較難維持強度。
正當尼格於南海西移,一股強烈東北季候風影響華南。尼格令氣壓梯度增加,本港風力於 2 日下午逐步增強。風勢於 3 日持續,並有幾陣驟雨,但風向維持偏北或東北。天文台於早上 6 時 40 分發出三號強風信號,長洲、青洲和橫瀾島等地錄得強風,部分高地站如昂坪和大老山更吹烈風。尼格當天早上向西北偏西移動,與香港的距離稍為縮窄,但風向仍未轉為偏東;加上 2 日晚氣溫和露點溫度明顯下降,顯示東北季候風似乎為導致香港吹強風的主因。
隨著尼格向西移動,它於 10 月 3 日約早上 11 時最接近香港,當時位於本港以南約 510 公里。天文台指出尼格有跡象減弱,對香港的影響開始下降,並於下午 7 時 10 分以強烈季候風信號取代三號強風信號,表示季候風正主導本港風勢。這是天文台多年來首次以強烈季候風信號直接取代熱帶氣旋警告信號。由於低窪地區 2 日晚曾出現海水倒灌,天文台提醒居民留意當晚將再出現水浸。

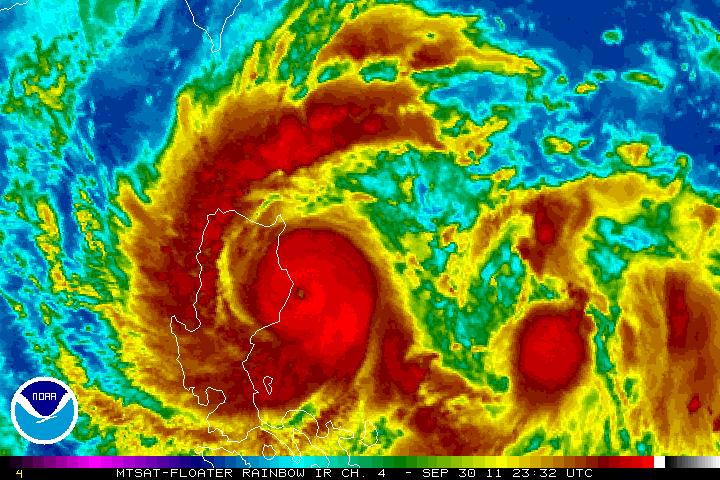
Figure 5 - NALGAE about to make landfall at Luzon
圖 5 - 尼格即將登陸呂宋
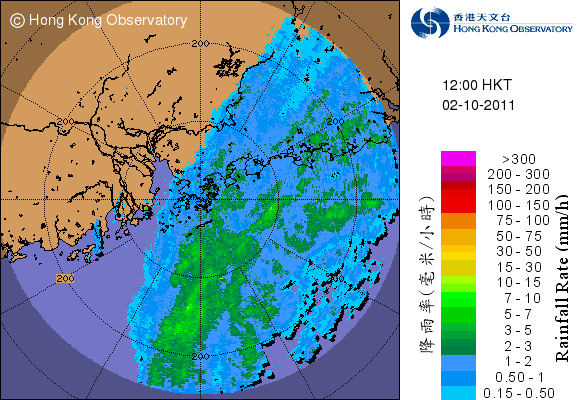
Figure 6 - NALGAE's outer rainband affecting Hong Kong
圖 6 - 尼格的外圍雨帶影響香港
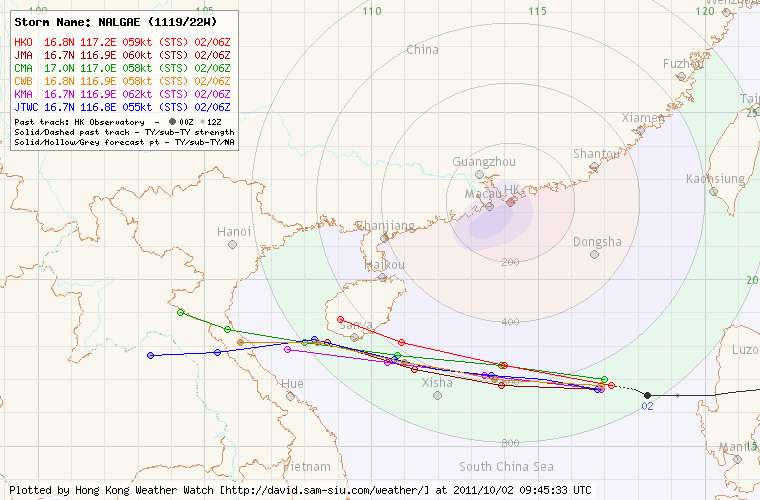
Figure 7 - Forecast tracks by various official agencies on October 2
圖 7 - 官方氣象台 10 月 2 日之預測路徑
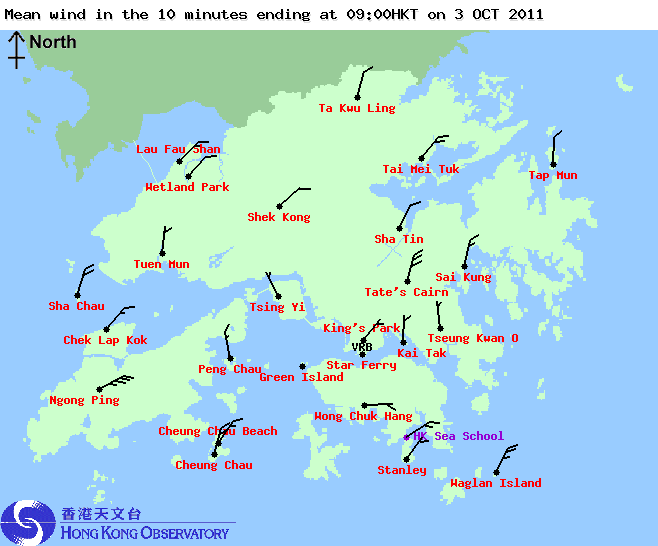
Figure 8 - Wind distribution in Hong Kong
圖 8 - 本港風向和風速分佈
Figure 9 - Air temperature, relative humidity and dew point time series from Oct 1 to Oct 4
圖 9 - 10 月 1 至 4 日之氣溫、相對濕度和露點時間序列圖
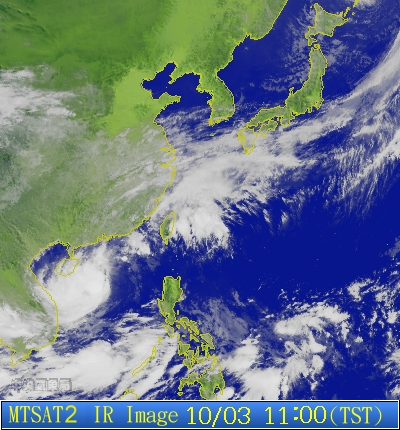
Figure 10 - NALGAE at closest approach to Hong Kong
圖 10 - 尼格於最接近香港之位置
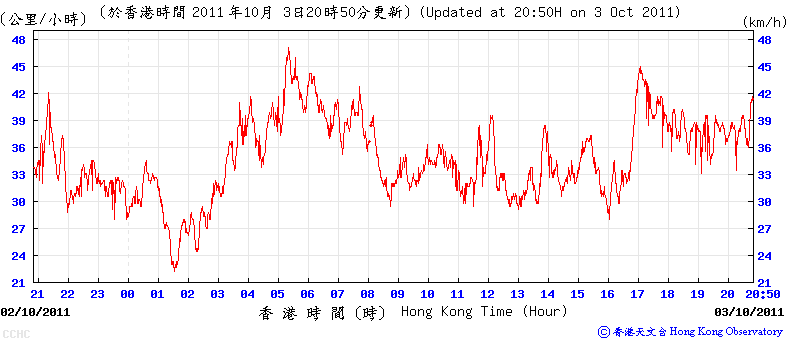
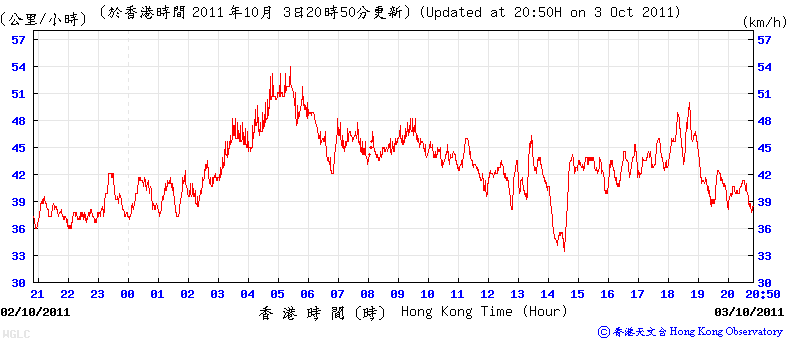
Figures 11a and 11b - Wind speed time series at Cheung Chau and Waglan Island
圖 11a 及 11b - 長洲和橫瀾島的風速時間序列圖
| Landfall at Hainan and Dissipation 登陸海南與消散 |
NALGAE's circulation was partly exposed as most convections were displaced to its western semicircle. It weakened into a tropical storm in the small hours of October 4 and made landfall near Wanning, Hainan at around noon that day. NALGAE's clouds got thinner as it crossed the island and weakened into a tropical depression as it entered water again that night.
Due to unfavourable water temperatures and shear conditions, NALGAE weakened into an area of low pressure on October 5 over water, before it could reach Vietnam coast.
尼格的對流集中在其西面,它的低層環流中心部分外露。尼格於 10 月 4 日凌晨減弱為熱帶風暴,在中午時份登陸海南萬寧市。它的雲帶在橫過海南島時逐漸變薄,於當晚減弱為熱帶低氣壓。
受偏低水溫和較高風切影響,尼格於 5 日在到達越南海岸前減弱為低壓區。
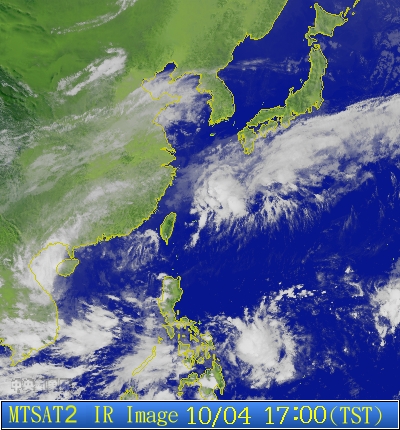
Figure 12 - NALGAE crossing Hainan Island
圖 12 - 尼格正橫過海南島
| Winds Recorded at Reference Stations 參考站所錄得的風速 |
| Station 風速站 |
Max. 10-min avg. wind speed 最高十分鐘平均風速 |
Beaufort classification 蒲福氏風級分類 |
| Chek Lap Kok 赤鱲角 | 40 km/h | Fresh 清勁 |
| Cheung Chau 長洲 | 47 km/h | STRONG 強風 |
| Kai Tak 啟德 | 23 km/h | Moderate 和緩 |
| Sai Kung 西貢 | 38 km/h | Fresh 清勁 |
| Sha Tin 沙田 | 26 km/h | Moderate 和緩 |
| Ta Kwu Ling 打鼓嶺 | 27 km/h | Moderate 和緩 |
| Tsing Yi (SHL) 青衣蜆殼油庫 | 19 km/h | Moderate 和緩 |
| Wetland Park 濕地公園 | 24 km/h | Moderate 和緩 |
| Number of stations recording at least STRONG force (force 6 - 7) winds: | 1 |
| Number of stations recording at least GALE force (force 8 - 9) winds: | 0 |
| Number of stations recording at least STORM force (force 10 - 11) winds: | 0 |
| Number of stations recording HURRICANE force (force 12) winds: | 0 |
| 錄得 強風 (6 - 7 級) 或更高風速的站數: | 1 |
| 錄得 烈風 (8 - 9 級) 或更高風速的站數: | 0 |
| 錄得 暴風 (10 - 11 級) 或更高風速的站數: | 0 |
| 錄得 颶風 (12 級) 風速的站數: | 0 |
| Charts and Figures 各項數據 |
Table 1: Track data from HKWW:
表一 : 香港天氣觀測站之路徑資料
YYMMDDZZ Lat Long Wind |
Table 2: Maximum gust and hourly average wind speed recorded in Hong Kong from HKO:
表二 : 香港天文台公佈的各站最高每小時平均風力和陣風數據
| Station | Maximum Gust |
Maximum Hourly Mean Wind |
||||||
Direction |
Speed (km/h) |
Date/Month |
Time |
Direction |
Speed (km/h) |
Date/Month |
Time |
|
| Bluff Head (Stanley) | NNE |
49 |
3/10 |
06:31 |
NE |
16 |
3/10 |
09:00 |
NE |
16 |
3/10 |
10:00 |
|||||
| Central Pier | NNE |
41 |
3/10 |
09:31 |
NNE |
23 |
3/10 |
13:00 |
| Cheung Chau | NE |
65 |
3/10 |
17:14 |
NNE |
43 |
3/10 |
06:00 |
| Cheung Chau Beach | NNE |
68 |
3/10 |
05:29 |
NE |
47 |
3/10 |
18:00 |
| Green Island | - |
72 |
3/10 |
12:01 |
- |
51 |
3/10 |
12:00 |
| Hong Kong International Airport | NE |
52 |
2/10 |
20:40 |
NE |
36 |
2/10 |
21:00 |
| Kai Tak | N |
52 |
3/10 |
11:31 |
NNE |
19 |
3/10 |
08:00 |
| King's Park | N |
43 |
3/10 |
09:26 |
N |
19 |
3/10 |
04:00 |
N |
19 |
3/10 |
05:00 |
|||||
| Lau Fau Shan |
NE |
58 |
3/10 |
08:32 |
NNE |
31 |
3/10 |
14:00 |
NE |
58 |
3/10 |
18:55 |
|||||
| Ngong Ping | ENE |
90 |
3/10 |
03:50 |
ENE |
67 |
3/10 |
09:00 |
ENE |
67 |
3/10 |
18:00 |
|||||
| North Point | ENE |
51 |
2/10 |
20:27 |
ENE |
22 |
3/10 |
18:00 |
ENE |
22 |
3/10 |
19:00 |
|||||
| Peng Chau | N |
47 |
3/10 |
07:24 |
N |
31 |
3/10 |
07:00 |
| Ping Chau | NE |
45 |
2/10 |
21:59 |
ENE |
12 |
2/10 |
23:00 |
| Sai Kung | NNE |
62 |
3/10 |
11:08 |
NNE |
31 |
3/10 |
12:00 |
| Sha Chau | NNE |
65 |
3/10 |
11:08 |
NNE |
47 |
3/10 |
12:00 |
| Sha Lo Wan | NE |
49 |
3/10 |
11:32 |
NE |
31 |
3/10 |
12:00 |
| Sha Tin | NNE |
51 |
3/10 |
16:37 |
NNE |
23 |
3/10 |
17:00 |
| Shek Kong | NE |
41 |
3/10 |
13:03 |
NE |
20 |
3/10 |
12:00 |
| Star Ferry (Kowloon) | NNE |
30 |
3/10 |
12:14 |
E |
19 |
2/10 |
13:00 |
| Ta Kwu Ling | NNE |
56 |
3/10 |
10:00 |
N |
25 |
3/10 |
12:00 |
| Tai Mei Tuk | NE |
65 |
3/10 |
17:02 |
NE |
40 |
3/10 |
18:00 |
| Tai Mo Shan | ENE |
87 |
3/10 |
18:03 |
ENE |
68 |
3/10 |
10:00 |
| Tap Mun | N |
45 |
3/10 |
10:26 |
N |
20 |
3/10 |
07:00 |
N |
20 |
3/10 |
11:00 |
|||||
| Tate's Cairn | N |
85 |
3/10 |
05:56 |
NNE |
67 |
3/10 |
06:00 |
| Tsak Yue Wu | NNE |
49 |
3/10 |
04:45 |
NNE |
25 |
3/10 |
11:00 |
| Tseung Kwan O | NNE |
45 |
3/10 |
07:40 |
N |
14 |
3/10 |
11:00 |
| Tsing Yi Shell Oil Depot | NW |
36 |
3/10 |
04:59 |
NNW |
16 |
3/10 |
06:00 |
| Tuen Mun Government Offices |
NNE |
54 |
3/10 |
10:50 |
NNE |
20 |
3/10 |
12:00 |
NNE |
54 |
3/10 |
11:24 |
|||||
| Waglan Island | NE |
62 |
3/10 |
18:16 |
NNE |
51 |
3/10 |
06:00 |
| Wetland Park | NE |
43 |
2/10 |
19:15 |
NE |
22 |
3/10 |
19:00 |
| Wong Chuk Hang | ESE |
54 |
3/10 |
09:07 |
ESE |
19 |
3/10 |
09:00 |
Table 3: Rainfall (in millimetres) contributed by NALGAE from HKO (figures in brackets are based on incomplete hourly data):
表三 : 香港天文台公佈的各站雨量資料 (方括號內之數據由不完整之每小時資料擷取)
| Station | 2 Oct |
3 Oct |
Total (mm) |
|
| Hong Kong Observatory | 3.3 |
1.6 |
4.9 |
|
| Hong Kong International Airport (HKA) | 2.2 |
1.9 |
4.1 |
|
| N26 | Cheung Chau | 3.0 |
5.0 |
8.0 |
| N05 | Fanling | 3.0 |
1.5 |
4.5 |
| N13 | High Island | 4.0 |
2.0 |
6.0 |
| K04 | Jordan Valley | 4.0 |
3.0 |
7.0 |
| N06 | Kwai Chung | 2.5 |
1.5 |
4.0 |
| H12 | Mid Levels | 3.0 |
2.0 |
5.0 |
| H21 | Repulse Bay | 3.0 |
2.5 |
5.5 |
| N09 | Sha Tin | 2.5 |
1.0 |
3.5 |
| H19 | Shau Kei Wan | 2.5 |
3.0 |
5.5 |
| SEK | Shek Kong | 3.0 |
2.5 |
5.5 |
| K06 | So Uk Estate | 3.0 |
2.0 |
5.0 |
| R31 | Tai Mei Tuk | 2.0 |
[1.0] |
[3.0] |
| R21 | Tap Shek Kok | 2.5 |
[1.0] |
[3.5] |
| N17 | Tung Chung | 3.5 |
4.0 |
7.5 |
| R27 | Yuen Long | 3.5 |
[0.5] |
[4.0] |
Last Accessed 最近訪問日期: Sun Sep 08 2024 12:35:59 HKT
Last Modified 最近修訂日期: Mon Jul 24 2023
