
TC Watch > Selected TC Review > 200821W (HIGOS) [Refresh]
 200821W (HIGOS) - Profile 200821W (HIGOS) - Profile |
(First issued on October 30th, 2008, final version issued on November 6th, 2008)
Brief profile of HIGOS:
| JTWC number | 21W |
| International number | 0817 |
| Period of existence | 29 September, 2008 14 HKT to 4 October, 2008 14 HKT* |
| Lifetime | 5.00 days* |
| Maximum 1-minute wind (JTWC) | 45 knots |
| Minimum pressure (JTWC) | 989 hPa |
| Highest TC signal by HKO (if applicable) | 1 (Standby Signal) |
| Closest point of approach by HKO (if applicable) | W 330 km (real-time warning**) / N/A (TC report) |
| Time of closest approach by HKO (if applicable) | 5 October, 2008 02 HKT (real-time warning**) / N/A (TC report) |
| Lowest pressure recorded at HKO (if applicable) | 1007.7 hPa (4 October, 2008 17:00 to 17:01 HKT) |
*Based on JTWC bulletins.
**Based on the final South China Coastal Waters bulletin before downgrading HIGOS into an area of low pressure.
TC signals for Hong Kong & Track:
Table:
Signal |
Date and time |
Distance from HK |
Predicted movement |
Max. 10-min winds |
 |
2008/10/02 (THU) 19:30 HKT |
S 690 km |
NW/WNW at 20 km/h |
56 km/h (30 knots, TD) |
 |
2008/10/04 (SAT) 22:30 HKT |
WSW 350 km |
N/NNE at 8 km/h |
56 km/h (30 knots, TD) |
Figure: (Track courtesy of Lorenzo. Data from HKO.)

IR imagery animation 紅外線雲圖動畫:
TC track from HKWW:

TC tracks from HKO:


| Past HKWW Bulletins on HIGOS |
Please click here for bulletins on HIGOS.
| Storm Formation and Development |
A disturbance 99W developed off the eastern Philippine coast on September 29th. Initial forecasts called for a retreat of the subtropical ridge anchored northeast of the system, leading to gradual recurvature in the South China Sea towards northeastern South China Sea. However it turned out that the ridge was once again stronger than expected and this system moved much more west than forecast.
The JTWC upgraded this system into a tropical depression on September 29th, giving it the temporary number 21W. 21W intensified gradually into a tropical storm on September 30th, and the JMA upgraded it to tropical storm status at 08 HKT. The name HIGOS was assigned to this storm together with the upgrade.
HIGOS reached maximum intensity in the middle of September 30th while moving northwestward, after which it made landfall at eastern Philippines. It weakened considerably while crossing the islands, and at one point it was so disorganized that convective cloud bands were not discernible on satellite images. Low-level steering continued to guide HIGOS towards the west, and HIGOS' centre just skirted past Manila

Figure 1 - Initial track by various agencies

Figure 2 - Steering chart at 14 HKT, September 30th (HIGOS was about to make landfall at eastern Philippines at that time)

Figure 3 - Visible imagery of HIGOS at 14:30 HKT, October 1st
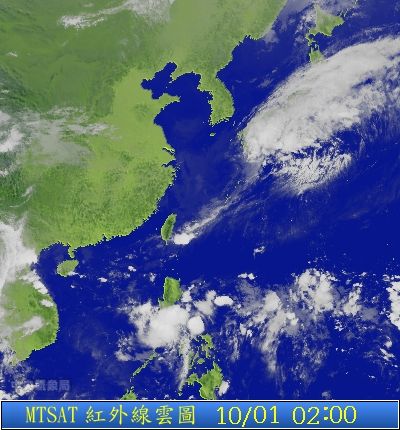
Figure 4 - IR image of HIGOS earlier at 02:00 HKT, October 1st. Note HIGOS' loose cloud bands.
| Entering South China Sea |
HIGOS entered South China Sea on late October 1st. Since it has been keeping a rather westward track, most major agencies shifted the forecast track west, predicting a landfall in the proxiimity of Hong Kong. A weakness started to develop to the north of the system, but the weakness did not amplify enough to induce poleward movement until October 3rd.
Convections improved slightly on the next day as the storm progressed west-northwestward on October 2nd. With the perception of possible adverse weather two to three days later, the Observatory issued the Number 1 Standby Signal [issuance document here] at 19:30 HKT that day, when HIGOS was about 690 kilometres south of Hong Kong.

Figure 5 - Steering chart at 14 HKT, October 2nd
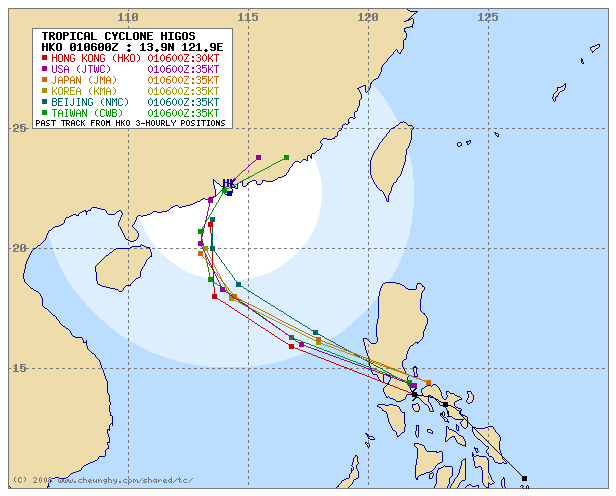
Figure 6 - Forecast track by various agencies, predicting a landfall near Hong Kong
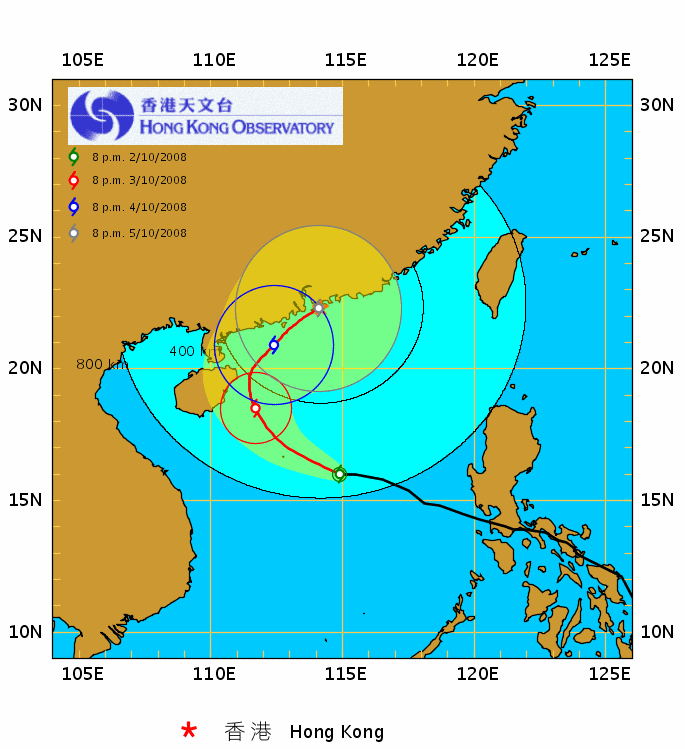
Figure 7 - Hong Kong Observatory's direct hit forecast
| Higos' Landfalls |
HIGOS continued its WNW track and was edging Hainan Island. The Hong Kong Observatory upgraded HIGOS into a tropical storm at 10 HKT on October 3rd as its structure improved. HIGOS finally started to decelerate in the latter part on October 3rd as the weakness in the subtropical ridge north of the storm deepened.
Just before reaching Hainan, HIGOS turned due north towards western Guangdong. The Observatory still predicted a pretty near closest point of approach (CPA), but has now shifted this CPA to north of Hong Kong with weakened intensity. HIGOS made landfall at the eastern tip of Hainan Island at 23 HKT that day.
Land interaction caused HIGOS to weaken and its cloud bands became less organized. In response, the Observatory downgraded HIGOS into a tropical depression at 10 HKT on October 4th. HIGOS moved slowly on that day and finally made its second landfall at Wuchuan City (吳川市) at 17 HKT the same day. Since HIGOS did not show signs of recurving to the east and has already landed, the Observatory cancelled the Standby Signal at 22:30 HKT that night.
Figure 8 - RADAR image at 21:32 HKT on October 3rd. At that time HIGOS was about to make landfall at Hainan.
| Subsequent Track and Effects on Hong Kong after Landfall |
However, instead of moving into land and dissipate, HIGOS turned ENE and moved along the coast on October 5th. From RADAR images by China, HIGOS' rainbands tightened and its structure improved a bit. Affected by the rainbands, occasional heavy rain was observed in Hong Kong early that day and the Amber Rainstorm Warning was in force from 08:50 to 11:30 HKT. Later in the afternoon, force 7 winds and a minimum pressure of 1000.5 hPa was recorded at Shangchuan Dao. As HIGOS (or HIGOS' remnants) moved further eastward, southerly winds in Hong Kong started to pick up just before dusk. The Hong Kong Observatory issued the Strong Monsoon Signal [issuance document here] at 17:45 HKT (although the winds were hardly contributed by monsoon) as HIGOS' rainbands swept past Hong Kong. The Observatory also mentioned in their Thunderstorm Warning bulletin that gusts of 100 km/h or more would affect the territory. The Amber Rainstorm Warning was issued for the second time on that day at 18:15 HKT as Hong Kong was hit by another major rainband; the signal was in force until 20:40 HKT.
The cyclonic system turned NE as it reached Macau, and was just tens of kilometres away from Hong Kong that night. Winds turned clockwise to southwesterlies at that time. It finally moved further inland in the early hours of October 6th and tranformed completely into an extratropical cyclone later that day.
Mr. Lam Chiu-ying, the Director of the Observatory, mentioned in his blog that HIGOS' remnants developed frontal characteristics which accounted for the temperature difference between the two sides of the cyclonic system (and also explained why Hong Kong experienced a drop in temperature in early October 6th). As a temperate cyclone, the potential energy from the temperature difference of air parcels converted into kinetic energy that fuelled the storm and led to its temporary intensification on October 5th. He mentioned that since the situation was "a temperate depression coming about in the background of the monsoon", the Strong Monsoon Signal was the only rational way to represent this event, and this set a precedent for similar episodes in the future. (However, it remained arguable whether or not the Strong Monsoon Signal was really appropriate for the situation, as winds from a genuine monsoon and that from a cyclonic system could have different characteristics and most importantly, imply different precautionary measures to be performed.)

Figure 9 - Visible imagery of HIGOS at 14:30 HKT, October 5th
Figure 10 - RADAR image at 11:55 HKT on October 5th. HIGOS appeared to be gaining strength at that time.

Figure 11 - Pressure time series at Shangchuan Dao between 14 HKT, October 4th and 20 HKT, October 5th
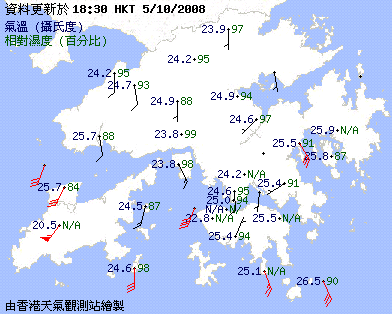
Figure 12 - Weather elements around Hong Kong, 18:30 HKT on October 5th
Figure 13 - Wind direction in various parts within Dongguan City. Note that the centre of the cyclonic system was near the top left corner of the plot.
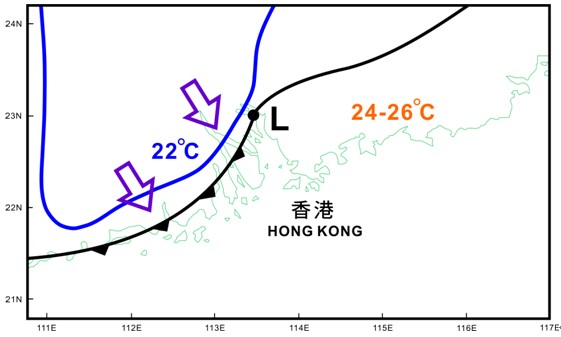
Figure 14 - The Observatory's claim on HIGOS' frontal features
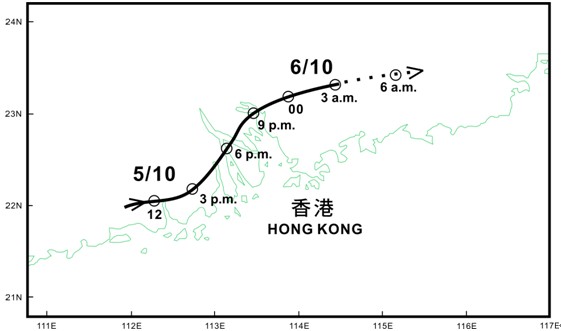
Figure 15 - The Observatory's preliminary track of HIGOS near Hong Kong
| Winds Recorded at Reference Stations |
(Except for special cases, this section is not available for cyclones that only necessitated the Standby Signal)
| Charts and Figures |
Table 1: Track data from HKWW:
YYMMDDZZ Lat Long Wind |
Table 2: Maximum gust and 60-minute average wind speed recorded in Hong Kong from HKO:
| Maximum Gust | Maximum Hourly Wind | |||||||
| Station | Direction | Speed (km/h) | Date/Month | Time | Direction | Speed (km/h) | Date/Month | Time |
| Bluff Head (Stanley) | NNE | 56 | 3/10 | 23:57 | NE | 34 | 3/10 | 20:00 |
| Central Pier | ENE | 45 | 3/10 | 13:45 | E | 31 | 3/10 | 06:00 |
| E | 31 | 4/10 | 01:00 | |||||
| Cheung Chau | E | 62 | 4/10 | 03:10 | E | 38 | 4/10 | 08:00 |
| Cheung Sha Wan | NE | 34 | 3/10 | 12:17 | ENE | 13 | 3/10 | 09:00 |
| Green Island | ENE | 65 | 3/10 | 08:23 | ENE | 51 | 3/10 | 13:00 |
| ENE | 65 | 3/10 | 12:29 | |||||
| Hong Kong International Airport | S | 54 | 4/10 | 18:05 | SE | 31 | 4/10 | 14:00 |
| Kai Tak | ENE | 54 | 3/10 | 13:36 | E | 30 | 3/10 | 20:00 |
| King's Park | E | 41 | 3/10 | 15:07 | E | 20 | 3/10 | 13:00 |
| Lau Fau Shan | E | 49 | 3/10 | 12:17 | SSE | 31 | 4/10 | 15:00 |
| Ngong Ping | SW | 110 | 4/10 | 22:11 | E | 59 | 4/10 | 01:00 |
| North Point | E | 47 | 4/10 | 01:24 | E | 25 | 3/10 | 17:00 |
| E | 25 | 4/10 | 01:00 | |||||
| Peng Chau | ENE | 52 | 3/10 | 14:04 | ENE | 36 | 4/10 | 01:00 |
| ENE | 52 | 3/10 | 14:08 | |||||
| Ping Chau | E | 43 | 3/10 | 13:57 | E | 16 | 3/10 | 14:00 |
| Sai Kung | ENE | 45 | 3/10 | 19:55 | ENE | 31 | 3/10 | 20:00 |
| Sha Chau | SSE | 54 | 4/10 | 16:22 | SSE | 34 | 4/10 | 17:00 |
| Sha Lo Wan | SE | 49 | 4/10 | 22:12 | E | 27 | 3/10 | 15:00 |
| Sha Tin | ESE | 31 | 4/10 | 09:43 | SE | 16 | 4/10 | 14:00 |
| SE | 16 | 4/10 | 16:00 | |||||
| Shek Kong | E | 49 | 3/10 | 12:58 | E | 23 | 3/10 | 15:00 |
| Star Ferry (Kowloon) | ESE | 43 | 3/10 | 18:44 | E | 25 | 3/10 | 13:00 |
| ESE | 25 | 3/10 | 15:00 | |||||
| Ta Kwu Ling | SE | 36 | 4/10 | 14:35 | SE | 14 | 4/10 | 15:00 |
| Tai Mei Tuk | E | 52 | 3/10 | 20:08 | E | 34 | 3/10 | 19:00 |
| Tai Mo Shan | E | 81 | 4/10 | 03:06 | E | 54 | 4/10 | 03:00 |
| Tate's Cairn | - | 70 | 4/10 | 01:08 | - | 41 | 3/10 | 15:00 |
| Tsak Yue Wu | E | 36 | 3/10 | 13:20 | ENE | 13 | 3/10 | 11:00 |
| ENE | 13 | 4/10 | 00:00 | |||||
| Tseung Kwan O | E | 38 | 3/10 | 12:04 | NNE | 14 | 3/10 | 09:00 |
| Tsing Yi Shell Oil Depot | SE | 40 | 4/10 | 13:48 | ESE | 23 | 4/10 | 19:00 |
| SE | 40 | 4/10 | 13:49 | |||||
| Tuen Mun Government Offices | ESE | 47 | 4/10 | 07:13 | SE | 22 | 4/10 | 22:00 |
| Waglan Island | E | 56 | 3/10 | 14:35 | E | 49 | 3/10 | 23:00 |
| E | 56 | 3/10 | 18:18 | |||||
| E | 56 | 3/10 | 18:31 | |||||
| Wetland Park | SSE | 40 | 4/10 | 15:42 | SSE | 20 | 4/10 | 16:00 |
| Wong Chuk Hang | E | 58 | 4/10 | 00:44 | E | 25 | 3/10 | 13:00 |
| E | 25 | 4/10 | 01:00 | |||||
Table 3: Rainfall contributed by HIGOS from HKO (figures in brackets are based on incomplete hourly data):
| Station | 2-Oct | 3-Oct | 4-Oct | 5-Oct | Total | |
| Hong Kong Observatory | 3.0 | 2.4 | 14.0 | 122.6 | 142.0 | |
| Cheung Chau (CCH) | 4.5 | 0.0 | 8.5 | 114.5 | 127.5 | |
| Hong Kong International Airport (HKA) | Trace | 0.2 | 4.5 | 83.1 | 87.8 | |
| H12 | Mid Levels | [2.0] | [3.0] | [21.0] | [101.5] | [127.5] |
| H19 | Shau Kei Wan | 2.5 | 3.5 | [7.0] | 101.0 | [114.0] |
| H21 | Repulse Bay | 3.0 | 3.5 | [6.0] | [84.0] | [96.5] |
| K04 | Jordan Valley | [0.5] | [0.0] | [22.0] | [29.5] | [52.0] |
| N05 | Fanling | 0.0 | 0.0 | [5.5] | 113.5 | [119.0] |
| N06 | Kwai Chung | 1.5 | 1.5 | [21.5] | 131.5 | [156.0] |
| N09 | Sha Tin | 0.0 | 1.5 | [11.5] | 107.5 | [120.5] |
| N12 | Yuen Long | 0.0 | 0.0 | [11.0] | 121.5 | [132.5] |
| N13 | High Island | 0.0 | 1.5 | [8.0] | 66.5 | [76.0] |
| N17 | Tung Chung | 0.0 | 3.5 | [9.0] | 138.5 | [151.0] |
| R21 | Tap Shek Kok | 0.0 | 0.0 | 4.5 | 68.5 | 73.0 |
| R26 | Shek Kong | 0.0 | 1.0 | 11.0 | [94.0] | [106.0] |
| R31 | Tai Mei Tuk | 0.0 | 0.0 | 33.0 | 97.5 | 130.5 |
Last Accessed: Sun Sep 08 2024 12:38:07 HKT
Last Modified: Mon Jul 24 2023
